Wednesday 28 February 2018

Migrating to Azure SQL Database with zero downtime for read-only workloads

Microsoft uses an internally written service called MSAsset to manage all Microsoft data center hardware around the world. MSAsset is used for tracking Microsoft’s servers, switches, storage devices, and cables across the company and requires 24/7 availability to accommodate break-fix requirements.

Before migrating to Azure SQL Database last year, MSAsset’s data tier consisted of a 107 GB database with 245 tables on SQL Server. The database was part of a SQL Server Always On Availability Group topology used for high availability and the scaling out of read-activity.

The MSAsset engineering team faced the following issues:

◈ Aging hardware was not keeping up with stability and scale requirements.
◈ There was an increase in high severity data-tier incidents and no database administrator on staff to help with troubleshooting, mitigation, root cause analysis and ongoing maintenance.
◈ MSAsset’s database ran on SQL Server 2012. Developers and internal customers were increasingly requesting access to new SQL Server functionality.

After exploring various options and weighing several factors, the MSAsset engineering team decided that Azure SQL Database was the appropriate data tier for their future investment and would address all of their key pain points. With the move to Azure SQL Database, they gained increased scalability, built-in manageability and access to the latest features.

With 24/7 availability requirements, the engineering team needed to find a way to migrate from SQL Server to Azure SQL Database without incurring downtime for read-only activity. MSAsset is a read-heavy service, with a much smaller percent of transactions involving data modifications. Using a phased approach, they were able to move to Azure SQL Database with zero downtime for read-only traffic and less than two hours of down time for read-write activity. This case study will briefly describe how this was accomplished.

The original MSAsset architecture


The original MSAsset application architecture consisted of a web tier with read-write access to the primary database located on a SQL Server 2012 instance. The database was contained within an Always On Availability Group with one synchronous read-only secondary replica and three read-only asynchronous secondary replicas. The application used an availability group listener to direct incoming write traffic to the primary replica. To accommodate the substantial amount of read-only reporting traffic, a proprietary load balancer was used to direct requests across the read-only secondary replicas using a round-robin algorithm.

Microsoft Azure Tutorials and Materials, Azure Learning, Azure SQL Database

When planning for a move to Azure SQL Database as with the legacy SQL Server solution, the proposed new solution needed to accommodate one read-write database and depending on the final migrated workload volume and associated Azure SQL Database resource consumption one or more read-only replicas.

Using a phased migration approach


The MSAsset engineering team used a phased incremental approach for moving from SQL Server to Azure SQL Database.  This incremental approach helped reduce the risk of project failure and allowed the team to learn and adapt to the inevitable unexpected variables that arise with complex application migrations.

The migration phases were as follows:

1. Configure hybrid SQL Server and Azure SQL Database read-only activity, while keeping all read-write activity resident on the legacy SQL Server database.

◈ Set up transactional replication from SQL Server to Azure SQL Database, for use in accommodating read-only activity.

◈ Monitor the replication topology for stability, performance, and convergence issues. 

◈ As needed, create up to four active geo-replication readable secondary databases in the same region to accommodate read-only traffic scale requirements.

◈ Once it is confirmed the topology is stable for a sustained period of time, use load-balancing to direct read-only activity to Azure SQL Database, beginning with 25 percent of the read-only traffic. Over a period of weeks, increase to 50 percent, and then 75 percent. For load balancing, the MSAsset engineering team uses a proprietary application-layer library.

◈ Along the way, use Query Performance Insight to monitor overall resource consumption and top queries by CPU, duration, execution count. MSAsset also monitored application metrics, including API latencies and error rates.

◈ Adjust the Azure SQL Database service tiers and performance levels as necessary.

◈ Move or redirect any high-resource consuming unnecessary legacy traffic to bulk access endpoints.

2. After stabilizing in the prior phase of 75 percent read-only activity on Azure SQL Database, move 100 percent of the read-only traffic to Azure SQL Database.

◈ Again, use Query Performance Insight to monitor overall resource consumption and top queries by CPU, duration, execution count. Adjust the Azure SQL Database service tiers and performance levels as necessary and create up to four active geo-replication readable secondary databases in the same region to accommodate read-only traffic.

3. Prior to the final cut-over to Azure SQL Database, develop and fully test a complete rollback plan. The MSAsset team used SQL Server Data Tools (SSDT) data comparison functionality to collect the delta between Azure SQL Database and a  four day old backup and then applied the delta to the SQL Server database.

4. Lastly, move all read-write traffic to Azure SQL Database. In MSAsset’s case, in preparation for the final read-write cutover they reseeded, via transactional replication a new database in Azure SQL Database for read-write activity moving forward. Steps they followed:

5. After the full reseeding, wait for remaining transactions on SQL Server to drain before removing the transactional replication topology.

6. Change the web front-end configuration to use the Azure SQL Database primary database for all read-write activity. Use read-only replicas for read-only traffic.

7. After a full business cycle of monitoring, de-commission the SQL Server environment.

This phased approach allowed the MSAsset team to incur no downtime for read-only activity and also helped them minimize risk, allowing enough time to learn and adapt to any unexpected findings without having to revert to the original environment. 

The final MSAsset architecture uses one read-write Azure SQL Database replica and four active geo-replication readable secondary databases. 

Microsoft Azure Tutorials and Materials, Azure Learning, Azure SQL Database

The remaining sections will talk about key aspects and lessons learned from the migration effort.

Creating a read-only Azure SQL Database using Transactional Replication


The first phase involved setting up transactional replication from SQL Server to Azure SQL Database, ensuring a stable replication topology with no introduced performance or convergence issues. 

The MSAsset engineering team used the following process for setting up transactional replication:

◈ They first reviewed the existing SQL Server database against the requirements for replication to Azure SQL Database. These requirements are detailed in the Replication to SQL Database documentation. For example, a small number of the legacy tables for MSAsset did not have a primary key, and so a primary key had to be added in order to be supported for transactional replication. Some of the tables were no longer being used, and so it was an opportunity to clean up stale objects and associated code.

◈ Since the MSAsset publication was hosted on an Always On Availability Group, the MSAsset team followed the steps detailed here for configuration transactional replication: Configure Replication for Always On Availability Groups (SQL Server).

Once transactional replication was configured and fully synchronized, read-only traffic was first directed to both SQL Server and Azure SQL Database with read-write activity continuing to go just against the SQL Server-resident database.

Microsoft Azure Tutorials and Materials, Azure Learning, Azure SQL Database

The read-only traffic against Azure SQL Database was incrementally increased over time to 25 percent, 50 percent, and 75 percent, with careful monitoring along the way to ensure sufficient query performance and DTU availability. The MSAsset team used a proprietary load balancing application library to distribute load across the various read-only databases. Once stabilized at 75 percent, the MSAsset team moved 100 percent of read-only activity to Azure SQL Database and continued with the other phases described earlier.

Cleanup opportunities


The MSAsset team also used this as an opportunity to clean up rogue reporting processes. This included in-house Microsoft reporting tools and applications that, while being permitted to access the database had other data warehouse options that were more appropriate for ongoing use than MSAsset. When encountering rogue processes, the MSAsset team reached out to the owners and had them re-route to appropriate data stores. Disused code and objects, when encountered, were also removed.

Redesigning around compatibility issues


The MSAsset team discovered two areas that required re-engineering prior to migration to Azure SQL Database:

◈ Change Data Capture (CDC) was used for tracking data modifications on SQL Server. This process was replaced with a solution that leverages temporal tables instead.

◈ SQL Server Agent Jobs were used for executing custom T-SQL scheduled jobs on SQL Server. All SQL Server Agent Jobs were replaced with Azure worker roles that invoked equivalent stored procedures instead.

Understanding networking and connectivity with Azure SQL Database


With an array of services requiring access to MSAsset’s data tier, the engineering team had to familiarize themselves with Azure SQL Database networking and connectivity requirements as well as fundamentals. Having this background was a critical aspect of the overall effort and should be a core focus area of any migration plan to Azure SQL Database.

Modernizing the platform and unlocking cloud scalability


The original MSAsset SQL Server hardware was powerful, but old. Before moving to Azure SQL Database, the MSAsset engineering considered replacing the servers. But they were concerned about the projected cost and ability for the hardware to keep up with MSAsset’s projected workload growth over the next five years. The MSAsset engineering team was also concerned about keeping up with the latest SQL Server versions and having access to the latest features.

Moving to Azure SQL Database means that the MSAsset team can scale resources much more easily and no longer have to worry about outgrowing their existing hardware. They can also now access new features as they become available in Azure SQL Database without having to explicitly upgrade. They are also now able to leverage built-in capabilities unique to Azure SQL Database like Threat Detection and Query Performance Insight.

Reducing high severity issues and database management overhead


The MSAsset engineering team has no database administrator on staff, so coupled with the support of old hardware and standard DBA maintenance requirements, these factors were a major contributor to increasingly frequent high severity incidents.

Moving to Azure SQL Database, the MSAsset team no longer worries about ongoing database server patching, backups, or complex high availability and disaster recovery topology configuration. Since moving to Azure SQL Database, the MSAsset engineering team has seen an 80 percent reduction in high severity issues for their data tier.

Saturday 24 February 2018

LUIS.AI: Automated Machine Learning for Custom Language Understanding

Conversational systems are rapidly becoming a key component of solutions such as virtual assistants, customer care, and the Internet of Things. When we talk about conversational systems, we refer to a computer’s ability to understand the human voice and take action based on understanding what the user meant. What’s more, these systems won’t be relying on voice and text alone. They’ll be using sight, sound, and feeling to process and understand these interactions, further blurring the lines between the digital sphere and the reality in which we are living. Chatbots are one common example of conversational systems.

Chatbots are a very trendy example of conversational systems that can maintain a conversation with a user in natural language, understand the user’s intent and send responses based on the organization’s business rules and data. These chatbots use Artificial Intelligence to process language, enabling them to understand human speech. They can decipher verbal or written questions and provide responses with appropriate information or direction. Many customers first experienced chatbots through dialogue boxes on company websites. Chatbots also interact verbally with consumers, such as Cortana, Siri and Amazon’s Alexa. Chatbots are now increasingly being used by businesses to augment their customer service.

Language understanding (LU) is a very centric component to enable conversational services such as bots, IoT experiences, analytics, and others. In a spoken dialog system, LU converts from the words in a sentence into a machine-readable meaning representation, typically indicating the intent of the sentence and any present entities. For example, consider a physical fitness domain, with a dialog system embedded in a wearable device like a watch. This dialog system could recognize intents like StartActivity and StopActivity, and could recognize entities like ActivityType. In the user input “begin a jog”, the goal of LU is to identify the intent as StartActivity, and identify the entity ActivityType= ’’jog’’.

Historically, there have been two options for implementing LU, machine learning (ML) models and handcrafted rules. Handcrafted rules are accessible for general software developers, but they are difficult to scale up, and do not benefit from data. ML-based models are trained on real usage data, generalize to new situations, and are superior in terms of robustness. However, they require rare and expensive expertise, access to large sets of data, and complex Machine Learning (ML) tools. ML-based models are therefore generally employed only by organizations with substantial resources.

In an effort to democratize LU, Microsoft’s Language Understanding Intelligent Service, LUIS shown in Figure 1 aims at enabling software developers to create cloud-based machine-learning LU models specific to their application domains, and without ML expertise. It is offered as part of the Microsoft Azure Cognitive Services Language offering. LUIS allows developers to build custom LU models iteratively, with the ability to improve models based on real traffic using advanced ML techniques. LUIS technologies capitalize on the continuous innovation of Microsoft in Artificial Intelligence and its applications to natural language understanding with research, science, and engineering efforts dating back at least 20 years or more. In this blog, we dive deeper into the LUIS capabilities to enable intelligent conversational systems. We also highlight some of our customer stories that show how large enterprises use LUIS as an automated AI solution to build their LU models.

Microsoft Tutorials and Materials, Azure Guides, Azure Certifications, Microsoft Learning

Figure 1: Language Understanding Service

Building Language Understanding Model with LUIS


A LUIS app is a domain-specific language model designed by you and tailored to your needs. LUIS is a cloud-based service that your end users can use from any device. It supports 12 languages and is deployed in 12 regions across the globe making it an extremely attractive solution to large enterprises that have customers in multiple countries.

You can start with a prebuilt domain model, build your own, or blend pieces of a prebuilt domain with your own custom information. Through a simple user experience, developers start by providing a few example utterances and labeling them to bootstrap initial reasonably-accurate application. The developer trains and publishes the LUIS app to obtain an HTTP endpoint on Azure that can receive real traffic. Once your LUIS application has endpoint queries, LUIS enables you to improve individual intents and entities that are not performing well on real traffic through active learning. In the active learning process, LUIS examines all the endpoint utterances, and selects utterances that it is unsure of. If you label these utterances, train, and publish, then LUIS identifies utterances more accurately. It is highly recommended that you build your LUIS application in multiple short and fast iterations where you use active learning to improve individual intents and entities until you obtain satisfactory performance. Figure 2 depicts the LUIS application development lifecycle.

Microsoft Tutorials and Materials, Azure Guides, Azure Certifications, Microsoft Learning

Figure 2: LUIS Application Development Lifecycle

After the LUIS app is designed, trained, and published, it is ready to receive and process utterances. The LUIS app receives the utterance as an HTTP request and responds with extracted user intentions. Your client application sends the utterance and receives LUIS's evaluation as a JSON object, as shown in Figure 3. Your client app can then take appropriate action.

Microsoft Tutorials and Materials, Azure Guides, Azure Certifications, Microsoft Learning

Figure 3: LUIS Input Utterances and Output JSON

There are three key concepts in LUIS:

◈ Intents: An intent represents actions the user wants to perform. The intent is a purpose or goal expressed in a user's input, such as booking a flight, paying a bill, or finding a news article. You define and name intents that correspond to these actions. A travel app may define an intent named "BookFlight."
◈ Utterances: An utterance is text input from the user that your app needs to understand. It may be a sentence, like "Book a ticket to Paris", or a fragment of a sentence, like "Booking" or "Paris flight." Utterances aren't always well-formed, and there can be many utterance variations for a particular intent.
◈ Entities: An entity represents detailed information that is relevant in the utterance. For example, in the utterance "Book a ticket to Paris", "Paris" is a location. By recognizing and labeling the entities that are mentioned in the user’s utterance, LUIS helps you choose the specific action to take to answer a user's request.

LUIS supports a powerful set of entity extractors that enable developers to build apps that can understand sophisticated utterances. LUIS offers a set of pre-built entities that offer common types which developers need often in their apps like date and time recognizers, money, number, etc. Developers can build custom entities based on top-notch machine learning algorithms as well as lexicon-based entities or a blend of both. Entities created through machine learning could be simple entities like “organization name”, hierarchical or composite. Additionally, LUIS enables developers to build list entities that are lexicon-based in a quick and easy way through recommended entries offered by huge-size dictionaries mined from the web.

Hierarchical entities span more than one level to model “Is-A” relation between entities. For instance, to analyze an utterance like “I want to book a flight from London to Seattle”, you need to build a model the could differentiate between the origin “London” and the destination “Seattle” given that both are cities. In that case, you build a hierarchical entity “Location” that has two children “origin” and “destination”.

Composite entities model “Has-A” relation among entities. For instance, to analyze an utterance like “I want to order two fries and three burgers”, you want to make sure that the utterance analysis binds “two” with “fries” and “three” with “burgers”. In this case, you build a composite entity in LUIS called “food order” that is composed of “number of items” and “food type”.

LUIS provides a set of powerful tools to help developers get started quickly on building custom language understanding applications. These tools are combined with customizable pre-built apps and entity dictionaries, such as calendar, music, and devices, so you can build and deploy a solution more quickly. Dictionaries are mined from the collective knowledge of the web and supply billions of entries, helping your model to correctly identify valuable information from user conversations.

Prebuilt domains as shown in Figure 4 are pre-built sets of intents and entities that work together for domains or common categories of client applications. The prebuilt domains have been pre-trained and are ready for you to add to your LUIS app. The intents and entities in a prebuilt domain are fully customizable once you've added them to your app. You can train them with utterances from your system so they work for your users. You can use an entire prebuilt domain as a starting point for customization, or just borrow a few intents or entities from a prebuilt domain.

Microsoft Tutorials and Materials, Azure Guides, Azure Certifications, Microsoft Learning

Figure 4: LUIS pre-built domains

LUIS provides developers with capabilities to actively learn in production and gives guidance on how to make the improvements. Once the model starts processing input at the endpoint, developers can go to the Improve app performance tab to constantly update and improve the model. LUIS examines all the endpoint utterances and selects utterances that it is unsure of and surfaces it to the developer. If you label these utterances, train, and publish, then LUIS processes these utterances more accurately.

LUIS has two ways to build a model, the Authoring APIs and the LUIS.ai web app. Both methods give you control of your LUIS model definition. You can use either LUIS.ai or the Authoring APIs or a combination of both to build your model. The management capabilities we provide includes models, versions, collaborators, external APIs, testing, and training.

Customer Stories


LUIS enables multiple conversational AI scenarios that were much harder to implement in the past. The possibilities are now vast, including productivity bots like meeting assistants and HR bots, digital assistants that present better service to customers and IoT applications. Our value proposition is strongly evidenced through our customers who use LUIS as an automated AI solution to enable their digital transformation.

UPS recently completed a transformative project that improves service levels via a Chatbot called UPS Bot, which runs on the Microsoft Bot Framework and LUIS. Customers can engage UPS Bot in text-based and voice-based conversations to get the information they need about shipments, rates, and UPS locations. According to Katie Duffy, Application Architect, UPS "Conversation as a platform is the future, so it's great that we’re already offering it to our customers using the Bot Framework and LUIS".

Working with Microsoft Services, Dixons Carphone has developed a Chatbot called Cami that is designed to help customers navigate the world of technology. Cami currently accepts text-based input in the form of questions, and she also accepts pictures of products’ in-store shelf labels to check stock status. The bot uses the automated AI capabilities in LUIS for conversational abilities, and the Computer Vision API to process images. Dixons Carphone programmed Cami with information from its online buying guide and store colleague training materials to help guide customers to the right product.

Rockwell Automation has customers in more than 80 countries, 22,000 employees, and reported annual revenue of US $5.9 billion in 2016. To give customers real-time operational insight, the company decided to integrate the Windows 10 IoT Enterprise operating system with existing manufacturing equipment and software, and connect the on-premises infrastructure to the Microsoft Azure IoT Suite. Instead of connecting an automation controller in a piece of equipment to a separate standalone computer, the company designed a hybrid automation controller with the Windows 10 IoT Enterprise operating system embedded next to their industry leading Logix 5000TM controller engine. The solution eliminates the need for a separate standalone computer and easily connects to the customer’s IT environment and Azure IoT Suite and Cognitive Services including LUIS for advanced analytics. 

LUIS is part of a much larger portfolio of capabilities now available on Azure to build AI applications. We’ve also launched the AI School to help developers get up to speed with all of the AI technologies shown in Figure 4.

Microsoft Tutorials and Materials, Azure Guides, Azure Certifications, Microsoft Learning

Figure 5: Resources for developers to get started with AI technologies.

Friday 23 February 2018

Monitor network connectivity to applications with NPM’s Service Endpoint Monitor - public preview

As more and more enterprises are hosting their applications in cloud and are relying more on SaaS and PaaS applications to provide services, they are increasingly becoming dependent on multiple external applications and the networks in between. The traditional network monitoring tools work in silos and do not provide end-to-end visibility. Therefore, if an application is found to be running slow, it becomes difficult to identify whether the problem is because of your network, the service provider or the application. Network Performance Monitor (NPM) introduces Service Endpoint Monitor that integrates the monitoring and visualization of the performance of your internally hosted & cloud applications with the end-to-end network performance. You can create HTTP, HTTPS, TCP and ICMP based tests from key points in your network to your applications, allowing you to quickly identify whether the problem is due to the network or the application. With the network topology map, you can locate the links and interfaces experiencing high loss and latencies, helping you identify external & internal troublesome network segments.

Some of the capabilities of NPM’s Service Endpoint Monitor are listed below:

Monitor end-to-end connectivity to applications


Service Endpoint Monitor monitors total response time, network latency and packet loss between your resources (branch offices, datacenters, office sites, cloud infrastructure) and the applications you use, such as websites, SaaS, PaaS, Azure services, File servers, SQL etc. By installing the NPM agents at the vantage points in your corporate perimeter, you can get the performance visibility from where your users are accessing the application. You can setup alerts to get proactively notified whenever the response time, loss or latency from any of your branch offices crosses the threshold. In addition to viewing the near real-time values and historical trends of the performance data, you can use the network state recorder to go back in time to view particular network state in order to investigate the difficult-to-catch transient issues.

Microsoft Online Guides, Microsoft Tutorials and Materials, Microsoft Certifications

Correlate application delivery with network performance


The capability plots both the response time as well as the network latency trends on the same chart. This helps you easily correlate the application response time with the network latency to determine whether the performance degradation is due to the network or the application.

The following snippet demonstrates one such scenario. The chart shows a spike in the application response time whereas the network latency is consistent. This suggests that the network was in a steady state, when the performance degradation was observed - therefore, the problem is due to an issue at the application end.

Microsoft Online Guides, Microsoft Tutorials and Materials, Microsoft Certifications

The example image below illustrates another scenario where spikes in the application response time are accompanied with corresponding spikes in the network latency. This suggests that the increase in response time is due to an increase in network latency, and therefore, the performance degradation is due to the underlying network.

Microsoft Online Guides, Microsoft Tutorials and Materials, Microsoft Certifications

Once You’ve established the network to be the problem area, you can then use the network topology view to identify the troublesome network segment.

Identify troublesome network interfaces and links


NPM’s interactive topology view provides end-to-end network visibility from your nodes to the application. You can not only view all the paths and interfaces between your corporate premises and application endpoint, but also view the latency contributed by each interface to help you identify the troublesome network segment. The below example image illustrates one such scenario where most of the latency is because of the highlighted network interface.

Microsoft Online Guides, Microsoft Tutorials and Materials, Microsoft Certifications

The below example image illustrates another scenario where you can get the network topology from multiple nodes to www.msn.com in a single pane of view and identify the unhealthy paths in red.

Microsoft Online Guides, Microsoft Tutorials and Materials, Microsoft Certifications

When you are using external services such as Office 365, several intermediate hops will be outside of your corporate network. You can simplify the topology map by hiding the intermediate hops using the slider control in filters. You can also choose to view only the unhealthy paths.

Microsoft Online Guides, Microsoft Tutorials and Materials, Microsoft Certifications

Built-in tests for Microsoft Office 365 and Microsoft Dynamics 365


NPM provides built-in tests that monitor connectivity to Microsoft’s Office 365 and Dynamics 365 services, without any pre-configuration.  The built-in tests provide simple one-click setup experience where you only have to choose the Office 365 and Dynamics 365 services you are interested in monitoring. Since the capability maintains a list of endpoints associated with these services, you do not have to enter the various endpoints associated with each service.

Microsoft Online Guides, Microsoft Tutorials and Materials, Microsoft Certifications

Create custom queries and views


All data that is exposed graphically through NPM’s UI is also available natively in Log Analytics search. You can perform interactive analysis of data in the repository, corelate data from different sources, create custom alerts, create custom views and export the data to Excel, PowerBI or a shareable link.

Saturday 17 February 2018

ExpressRoute monitoring with Network Performance Monitor (NPM) is now generally available

We are excited to share the general availability of ExpressRoute monitoring with Network Performance Monitor (NPM). Since then, we’ve seen lots of users monitor their Azure ExpressRoute private peering connections, and working with customers we’ve gathered a lot of great feedback. While we’re not done working to make ExpressRoute monitoring best in class, we’re ready and eager for everyone to get their hands on it. In this post, I’ll take you through some of the capabilities that ExpressRoute Monitor provides.

Monitor connectivity to Azure VNETs, over ExpressRoute


NPM can monitor the packet loss and network latency between your on-premises resources (branch offices, datacenters, and office sites) and Azure VNETs connected through an ExpressRoute. You can setup alerts to get proactively notified whenever the loss or latency crosses the threshold. In addition to viewing the near real-time values and historical trends of the performance data, you can use the network state recorder to go back in time to view particular network state in order to investigate the difficult-to-catch transient issues.

Get end-to-end visibility into the ExpressRoute connections


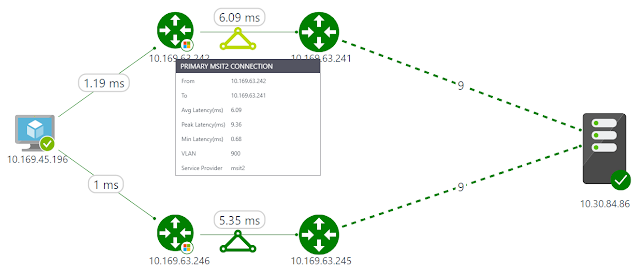
Since an ExpressRoute connection comprises of various components, it is extremely difficult to identify the bottleneck when high latency is experienced while connecting to an Azure workload. Now, you can get the required end-to-end visibility through NPM’s interactive topology view. You can not only view all the constituent components, your on-premises network, circuit provider edge, ExpressRoute circuit, Microsoft edge, and Azure VMs, but also the latency contributed by each hop to help you identify the troublesome segment.

The following snippet illustrates a topology view where the Azure VM on the left is connected to the on-premises VM on the right, over primary and secondary ExpressRoute connections. The Microsoft router at the Azure edge and the service provider router at the customer edge are also depicted. The nine on-premises hops (depicted by dashed lines) are initially compressed.

Azure Tutorials and Materials, Azure Certified, Azure Guides, Azure Certifications, Azure Learning

You can also choose to expand the map to view all the on-premises hops and understand the latency contributed by each hop.

Azure Tutorials and Materials, Azure Certified, Azure Guides, Azure Certifications, Azure Learning

Understand bandwidth utilization


This capability lets you view the bandwidth utilization trends for both the primary and secondary ExpressRoute circuits, and as a result, helps you in capacity planning. Not only can you view the aggregated bandwidth utilization for all the private peering connections of the ExpressRoute circuit, but you can also drill-down to understand the bandwidth utilization trend for each VNET. This will help you identify the VNETs that are consuming most of your circuit bandwidth.

Azure Tutorials and Materials, Azure Certified, Azure Guides, Azure Certifications, Azure Learning

You can also setup alerts to notify when the bandwidth consumed by a VNET crosses the threshold.

Azure Tutorials and Materials, Azure Certified, Azure Guides, Azure Certifications, Azure Learning

Diagnose ExpressRoute connectivity issues


NPM helps you diagnose several circuit connectivity issues. Below are examples of possible issue.

Circuit is down - NPM notifies you as soon as the connectivity between your on-premises resources and Azure VNETs is lost. This will help you take proactive action before receiving user escalations and reduce the downtime.

Azure Tutorials and Materials, Azure Certified, Azure Guides, Azure Certifications, Azure Learning

Traffic not flowing through intended circuit - NPM can notify you whenever the traffic is unexpectedly not flowing through the intended ExpressRoute circuit. This can happen if the circuit is down and the traffic is flowing through the backup route, or if there is a routing issue. This information will help you proactively manage any configuration issues in your routing policies and ensure that the most optimal and secure route is used.

Azure Tutorials and Materials, Azure Certified, Azure Guides, Azure Certifications, Azure Learning

Traffic not flowing through primary circuit - The capability notifies you when the traffic is flowing through the secondary ExpressRoute circuit. Even though you will not experience any connectivity issues in this case, proactively troubleshooting the issues with the primary circuit will make you better prepared.

Azure Tutorials and Materials, Azure Certified, Azure Guides, Azure Certifications, Azure Learning

Degradation due to peak utilization - You can correlate the bandwidth utilization trend with the latency trend to identify whether the Azure workload degradation is due to a peak in bandwidth utilization, or not, and take action accordingly.

Azure Tutorials and Materials, Azure Certified, Azure Guides, Azure Certifications, Azure Learning

Friday 16 February 2018

Announcing Virtual Network integration for Azure Storage and Azure SQL

We are glad to announce the public preview of Virtual Network (VNet) Service Endpoints for Azure Storage and Azure SQL.

For many of our customers moving their business-critical data to the cloud, data breaches remain a top concern. Various Azure services that store or process the business data have Internet-reachable IP addresses. Leaked credentials or malicious insiders with administrative privileges gaining access to the data, from anywhere in the world, is an increasing concern to our customers.

To protect against these threats, private connectivity to Azure services is becoming essential to moving more critical workloads to the cloud. Most customers want to limit access to their critical resources to only their private environments, i.e. their Azure Virtual Networks and on-premises.

While some of the Azure services can be directly deployed into VNets, many others still remain public. With VNet service endpoints, we are expanding Virtual Network support to more multi-tenant Azure services.

Service endpoints extend your VNet private address space and identity to the Azure services, over a direct connection. This allows you to secure your critical service resources to only your virtual networks, providing private connectivity to these resources and fully removing Internet access.

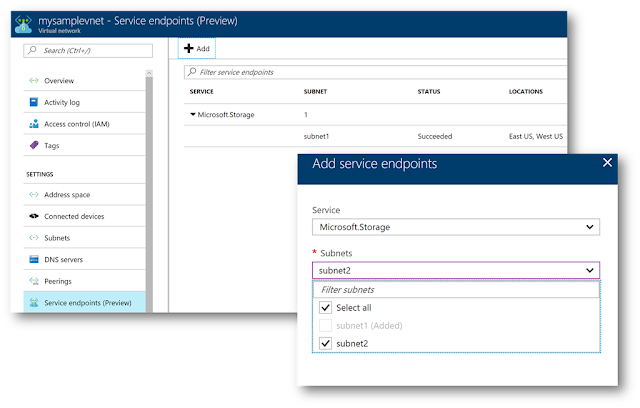
Configuring service endpoints is very simple with a single click on a subnet in your VNet. Direct route to the services is auto-configured for you. There are no NAT or gateway devices required to set up the endpoints. You also no longer need reserved, public IP addresses in your VNets to secure Azure resources through IP firewall. Service endpoints makes it easy to configure and maintain network security for your critical resources.

Step1: Set up service endpoints once on your Virtual Network. Network administrators can turn this setting independently, allowing for separation of duties.

Azure Tutorials and Materials, Azure Certifications, Azure Learning, Azure Guides

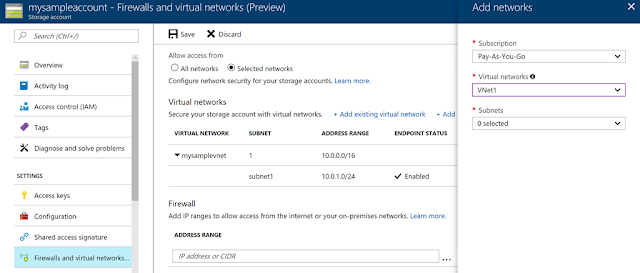
Step 2: Secure your new or existing Azure service resources to the VNet, with a simple click. Set up once for the Storage account or SQL server and automatically applies to any access to child resources. Data administrators can set up independently (optional).

Azure Tutorials and Materials, Azure Certifications, Azure Learning, Azure Guides


Azure Tutorials and Materials, Azure Certifications, Azure Learning, Azure Guides

Service endpoints is available in preview for below services and regions:

Azure Storage: WestUS, EastUS, WestCentralUS, WestUS2, AustraliaEast, and AustraliaSouthEast

Azure SQ: EastUS, WestCentralUS, WestUS2

We will be expanding the feature to more regions soon.

We are very excited to bring enhanced network security for your Azure service resources. This is only a beginning for our roadmap for tightening security for Azure services. We will expand the service endpoints to more Azure services. In addition to service endpoints, we are also very committed to giving you private connectivity to your Azure resources, from your firewalls and on-premises. Service tags is yet another investment in this direction, for your Network Security Groups (NSGs) to selectively open access only to Azure services from your VNets. Service tags is also available in preview now.

Wednesday 14 February 2018

Azure Network Security

In this blog, I will focus on security from a network perspective and describe how you can use Azure network capabilities to build highly secure cloud services. Four distinct areas highlight how we provide a secure network to customers:

◈ The foundation is Azure Virtual Network to provide a secure network fabric that provides an isolation boundary for customer networks.
◈ Virtual Network configuration and policies protect cloud applications.
◈ Active monitoring systems and tools provide security validation.
◈ An underlying physical network infrastructure with built-in advanced security hardening protects the entire global network.

Isolating customer networks in single shared physical network


To support the tremendous growth of our cloud services and maintain a great networking experience, Microsoft owns and operates one of the largest dark fiber backbones in the world—it connects our datacenters and customers. In Azure, we run logical overlay networks on top of the shared physical network to provide isolated private networks for customers.

Azure Network Security, Azure Security, Azure Certifications, Azure Guides, Azure Learning

Figure 2. Isolated customer virtual networks run on the same physical network

The overlay networks are implemented by Azure’s software defined networking (SDN) stack. Each overlay network is specifically created on demand for a customer via an API invocation. All configuration for building such networks is performed in software—this is why Azure can scale up to create thousands of overlay networks in seconds. Each overlay network is its own Layer 3 routing domain that comprises the customer’s Virtual Network (VNet).

Azure Virtual Network


Azure Virtual Network is a secure, logical network that provides network isolation and security controls that you treat like your on-premises network. Each customer creates their own structure by using: subnets—they use their own private IP address range, configure route tables, network security groups, access control lists (ACLs), gateways, and virtual appliances to run their workloads in the cloud. 

Figure 3 shows an example of two customer virtual networks. Customer 1’s VNet has connectivity to an on premises corporate network, while Customer 2’s VNet can be accessed only via Remote Desktop Protocol (RDP). Network traffic from the Internet to virtual machines (VMs) goes through the Azure load balancer and then to the Windows Server host that’s running the VM. Host and guest firewalls implement network port blocking and ACL rules.

Azure Network Security, Azure Security, Azure Certifications, Azure Guides, Azure Learning

Figure 3. Customer isolation provided by Azure Virtual Network

The VMs deployed into the VNet can communicate with one another using private IP addresses. You control the IP address blocks, DNS settings, security policies, and routing tables. Benefits include:

◈ Isolation: VNets can be isolated from one another, so you can create separate networks for development, testing, and production. You can also allow your VNets to communicate with each other.
◈ Security: By using network security groups, you can control the traffic entering and exiting the subnets and VMs.
◈ Connectivity: All resources within the VNet are connected. You can use VNet peering to connect with other Virtual Networks in the same region. You can use virtual private network (VPN) gateways to enable IPsec connectivity to VNets via the Internet from on-premises sites and to VNets in other regions. ExpressRoute provides private network connectivity to VNets that bypasses the Internet.
◈ High availability: Load balancing is a key part of delivering high availability and network performance to customer applications. All traffic to a VM goes through the Azure Load Balancer.

Securing your applications


A December 2016 survey of security professionals showed that their biggest year-over-year drop in confidence was in “the security of web applications, [which was] down 18 points from 80 percent to 62 percent.” Microsoft addresses potential vulnerabilities by building security into our applications and providing features and services to help customers enhance the security of their cloud-hosted applications from the development phase all the way to controlling access to the service.

Azure has a rich set of networking mechanisms that customers can use to secure their applications. Here are some examples.

Network ACLs can be configured to restrict access on public endpoint IP addresses. ACLs on the endpoint further restrict the traffic to only specific sources IP addresses.

Network Security Groups (NSGs) control network access to VMs in your VNet. This collection of network ACLs allows a full five-tuple (source IP address, source port, destination IP address, destination port, protocol) set of rules to be applied to all traffic that enters or exits a subnet or a VM’s network interface. The NSGs, associated to a subnet or VM, are enforced by the SDN stack.

Network virtual appliances (NVAs) bolster VNet security and network functions, and they’re available from numerous vendors via the Azure Marketplace. NVAs can be deployed for highly available firewalls, intrusion prevention, intrusion detection, web application firewalls (WAFs), WAN optimization, routing, load balancing, VPN, certificate management, Active Directory, and multifactor authentication.

Many enterprises have strict security and compliance requirements that require on-premises inspection of all network packets to enforce specific polices. Azure provides a mechanism called forced tunneling that routes traffic from the VMs to on premises by creating a custom route or by Border Gateway Protocol (BGP) advertisements through ExpressRoute or VPN.

Figure 4 shows an example of using NSG rules on segregated subnets and an NVA to protect the front end subnet. 

Azure Network Security, Azure Security, Azure Certifications, Azure Guides, Azure Learning

Figure 4. A perimeter network architecture built using Network Security Groups

Azure Application Gateway, our Layer 7 load balancer, also provides Web Application Firewall (WAF) functionality to protect against the most common web vulnerabilities.

Securely connecting from on-premises to Azure can be achieved via the Internet using IPsec to access our VPN Gateway service or with a private network connection using ExpressRoute. Figure 4 illustrates a perimeter network–style enhanced security design where Virtual Network access can be restricted using NSGs with different rules for the front end (Internet-facing) web server and the back-end application servers.

Azure Network Security, Azure Security, Azure Certifications, Azure Guides, Azure Learning

Figure 5. A secured VNet connected to an Internet front-end and back-end connected to on-premises

Security validation


Azure offers many tools to monitor, prevent, detect, and respond to security events. Customers have access to the Azure Security Center, which gives you visibility and control over the security of your Azure resources. It provides integrated security monitoring and policy management, helps detect threats, and works with a broad ecosystem of security solutions.

We also provide Network Watcher to monitor, diagnose, and gain insights into your Azure network. With diagnostic and visualization tools to monitor your network’s security and performance, you can identify and resolve network issues. For example, to view information about traffic coming into and going out of an NSG, Network Watcher provides NSG flow logs. You can verify that the NSGs are properly deployed, and see which unauthorized IPs are attempting to access your resources.

Azure Network Security, Azure Security, Azure Certifications, Azure Guides, Azure Learning

Figure 6. Capture NSG Flow Logs using Network Watcher

Azure Network Security, Azure Security, Azure Certifications, Azure Guides, Azure Learning

Network infrastructure security hardening


According to a 2015 Ponemon study, for businesses, the average cost per security breach is $15 million. To help protect your organization’s assets, Microsoft Cloud datacenters are protected by layers of defense-in-depth security, including perimeter fencing, video cameras, security personnel, secure entrances, real-time communications networks, and all physical servers are monitored. These regularly audited security measures help Azure achieve our strong portfolio of compliance certifications. 

For many years, we’ve used encryption in our products and services to protect our customers from online criminals and hackers. We don’t want to take any chances with customer data being breached and are addressing this issue head on. We have a comprehensive engineering effort to strengthen the encryption of customer data across our networks and services. This effort will provide protection across the full lifecycle of customer-created content.

Azure traffic between our datacenters stays on our global network and does not flow over the Internet. This includes all traffic between Microsoft Azure public cloud services anywhere in the world. For example, within Azure, traffic between VMs, storage, and SQL stays on the Microsoft network, regardless of the source and destination region. Intra-region VNet-to-VNet, as well as cross-region VNet-to-VNet traffic, stays on the Microsoft network.

Distributed denial of service (DDoS) attacks are a continually rising threat. Protecting against the growing scale and complexity of such attacks requires significant infrastructure deployed at global scale. Azure has a built-in DDoS protection system to shield all Microsoft cloud services. Therefore, all Azure public IPs fall under this protection deployed across all Azure datacenters. Our DDoS system uses dynamic threat detection algorithms to prevent common DDoS volumetric attacks (such as UDP floods, SYN-ACK attacks, or reflection attacks). We monitor hundreds of daily mitigated attack attempts and continually expand our protection.

Azure itself is also protected through active monitoring and intelligence gathering across the Internet. We continuously perform threat intelligence research into the dark web to identify and mitigate potential risks and attacks. This knowledge is applied to our protection techniques and mitigations. The Microsoft Cyber Defense Operations Center, highlighting our commitment, responds to security incidents.

Putting these investments together, we provide a layered security model, as shown in Figure 8 to protect your services running in Azure.

Azure Network Security, Azure Security, Azure Certifications, Azure Guides, Azure Learning

Figure 8. A layered approach to securing Azure

Secure Azure Networking


Azure has made significant investments in security. Customers can use Virtual Networks and our other security features and services to design, configure, and monitor their cloud applications. We aggressively monitor and continually harden our global infrastructure to address the ever-changing landscape of new cyber threats.

Microsoft continues to be a leader in the prevention of network security attacks. With our global footprint and experience running the most popular cloud services, we have both scale and a breadth of inputs to secure our network and help you secure your services. We will continue to invest in network security technologies so that you can safely—and in a compliant manner—build, deploy, monitor, and run your services in Azure.

Sunday 11 February 2018

OMS Monitoring solution for Azure Backup using Azure Log analytics

We are pleased to let you know that you can leverage the same workflow to build your own Microsoft Operations Management Suite (OMS) monitoring solution for Azure Backup in the upgraded OMS workspace. The OMS monitoring solution allows you to monitor key backup parameters such as backup and restore jobs, backup alerts, and cloud storage usage across Recovery Services vaults and subscriptions. You can then utilize OMS log analytics capabilities to raise further alerts for events that you deem important for the business to be notified of. You could even open tickets through webhooks or ITSM integration using the OMS log analytics capabilities.

Here’s how you do it…

Configuring Diagnostic settings


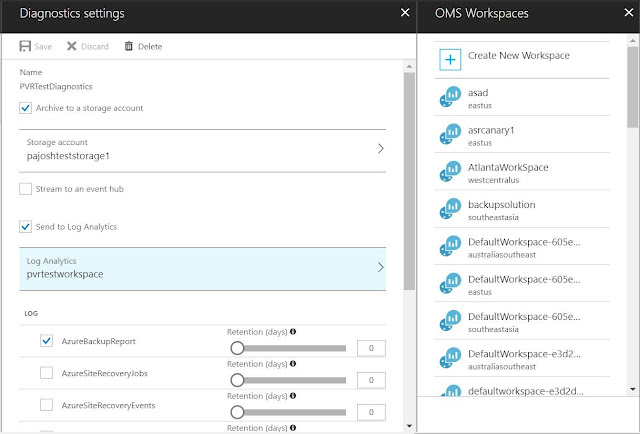
You can open the diagnostic setting window from the Azure Recovery services vault, or you can open the diagnostic setting window by logging into Azure portal. First, click “Monitor” service followed by “Diagnostic settings” in settings section. You can then specify the relevant Subscription, Resource Group, and Recovery Services Vault. In the Diagnostic settings window, as shown below, you can select “Send data to log analytics” and then select the relevant OMS workspace. You can choose any existing log analytics workspace, such that all vaults pump the data to the same workspace

Please select the relevant log, “AzureBackupReport” in this case, to be sent to the log analytics workspace. Click “Save” to save the setting.

Azure Tutorials and Materials, Azure Certifications, Azure Learning, Azure Guides

After you have completed the configuration, you should wait for 24 hours for initial data push to complete.

Deploying solution to Azure OMS


The OMS monitoring solution template for Azure Backup is a community driven project where you can deploy the base template to Azure and then customize it to fit your needs.

Monitoring Azure Backup data


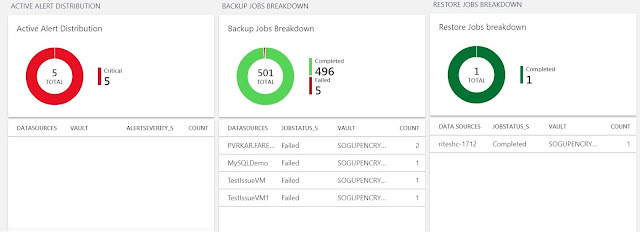
The overview tile in the dashboard reflects the key parameter, which is the backup jobs and their status.

Azure Tutorials and Materials, Azure Certifications, Azure Learning, Azure Guides

Clicking on the overview tile will take you to the dashboard where the solution has information categorized into jobs and alerts status, and active machines and their storage usage.

Azure Tutorials and Materials, Azure Certifications, Azure Learning, Azure Guides

Azure Tutorials and Materials, Azure Certifications, Azure Learning, Azure Guides

MAKE SURE YOU SELECT THE RIGHT DATE RANGE AT THE TOP OF THE SCREEN to filter the data for the required time interval.

Azure Tutorials and Materials, Azure Certifications, Azure Learning, Azure Guides

Log search capabilities


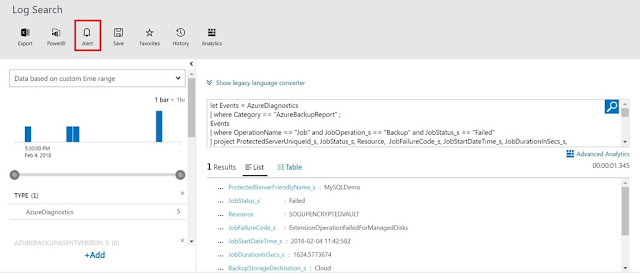
You can click on each tile to get more details about the queries used to create the tile and configure it to meet your requirement. Clicking further on values appearing in the tiles will lead you to the Log Analytics screen where you can raise alerts for configurable event thresholds and automate actions to be performed when those thresholds are met/crossed.

Azure Tutorials and Materials, Azure Certifications, Azure Learning, Azure Guides