Showing posts with label Monitoring. Show all posts

Saturday, 11 February 2023

Automate your attack response with Azure DDoS Protection solution for Microsoft Sentinel

DDoS attacks are most known for their ability to take down applications and websites by overwhelming servers and infrastructure with large amounts of traffic. However, there are additional objectives for cybercriminals to use DDoS attacks to exfiltrate data, extort, act politically, or ideologically. One of the most devastating features of DDoS attacks is their unique ability to disrupt and create chaos in targeted organizations or systems. This plays well for bad actors that leverage DDoS as smokescreen for more sophisticated attacks, such as data theft. This demonstrates the increasingly sophisticated tactics cybercriminals use to intertwine multiple attack vectors to achieve their goals.

Azure offers several network security products that help organizations protect their applications: Azure DDoS Protection, Azure Firewall, and Azure Web Application Firewall (WAF). Customers deploy and configure each of these services separately to enhance the security posture of their protected environment and application in Azure. Each product has a unique set of capabilities to address specific attack vectors, but the most benefit speaks to the power of relationship—when combined these three products provide more comprehensive protection. Indeed, to combat modern attack campaigns one should use a suite of products and correlate security signals from one to another, to be able to detect and block multi-vector attacks.

We are announcing a new Azure DDoS Protection Solution for Microsoft Sentinel. It allows customers to identify bad actors from Azure’s DDoS security signals and block possible new attack vectors in other security products, such as Azure Firewall.

Using Microsoft Sentinel as the glue for attack remediation


Each of Azure’s network security services is fully integrated with Microsoft Sentinel, a cloud-native security information and event management (SIEM) solution. However, the real power of Sentinel is in collecting security signals from these separate security services and analyzing them to create a centralized view of the attack landscape. Sentinel correlates events and creates incidents when anomalies are detected. It then automates the response to mitigate sophisticated attacks.

In our example case, when cybercriminals use DDoS attacks as smokescreen to data theft, Sentinel detects the DDoS attack, and uses the information it gathers on attack sources to prevent the next phases of the adversary lifecycle. By using remediation capabilities in Azure Firewall and other network security services in the future, the attacking DDoS sources are blocked. This cross-product detection and remediation magnifies the security posture of the organization, where Sentinel is the orchestrator.

Automated detection and remediation of sophisticated attacks


Our new Azure DDoS Protection Solution for Sentinel provides a single consumable solution package that allows customers to achieve this level of automated detection and remediation. The solution includes the following components:

1. Azure DDoS Protection data connector and workbook.

2. Alert rules that help retrieve the source DDoS attackers. These are new rules we created specifically for this solution. These rules may be utilized by customers to achieve other objectives for their security strategy.

3. A Remediation IP Playbook that automatically creates remediation in Azure Firewall to block the source DDoS attackers. Although we document and demonstrate how to use Azure Firewall for remediation, any 3rd party firewall that has a Sentinel Playbook can be used for remediation. This provides the flexibility for customers to use this new DDoS solution with any firewall.
The solution is initially released for Azure Firewall (or any third-party firewall), and we plan to enhance it to support Azure WAF soon.

Let’s see a couple of use cases for this cross-product attack remediation.

Use case #1: remediation with Azure Firewall

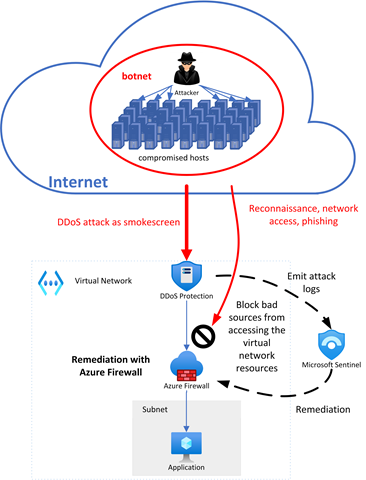
Let’s consider an organization that use Azure DDoS Protection and Azure Firewall, and consider the attack scenario in the following figure:

Azure DDoS Protection Solution, Azure, Azure Certification, Azure Career, Azure Skills, Azure Jobs, Azure Tutorial and Materials

An adversary controls a compromised bot. They starts with a DDoS smokescreen attack, targeting the resources in the virtual network for that organization. They then plan to access the network resources by scanning and phishing attempts until they’re able to gain access to sensitive data.

Azure DDoS Protection detects the smokescreen attack and mitigates this volumetric network flood. In parallel it starts sending log signals to Sentinel. Next, Sentinel retrieves the attacking IP addresses from the logs, and deploys remediation rules in Azure Firewall. These rules will prevent any non-DDoS attack from reaching the resources in the virtual network, even after the DDoS attacks ends, and DDoS mitigation ceases.

Use case #2: remediation with Azure WAF (coming soon)

Now, let’s consider another organization who runs a web application in Azure. It uses Azure DDoS Protection and Azure WAF to protect its web application. The adversary objective in this case is to attack the web application and exfiltrate sensitive data by starting with a DDoS smokescreen attack, and then launch web attacks on the application.

Azure DDoS Protection Solution, Azure, Azure Certification, Azure Career, Azure Skills, Azure Jobs, Azure Tutorial and Materials

When Azure DDoS Protection service detects the volumetric smokescreen attack, it starts mitigating it, and signals logs to Sentinel. Sentinel retrieves the attack sources and applies remediation in Azure WAF to block future web attacks on the application.

Get started with Azure DDoS protection today


As attackers employ advanced multi-vector attack techniques during the adversary lifecycle, it’s important to harness security services as much as possible to automatically orchestrate attack detection and mitigation.

For this reason, we created the new Azure DDoS Protection solution for Microsoft Sentinel that helps organizations to protect their resources and applications better against these advanced attacks. We will continue to enhance this solution and add more security services and use cases.

Source: microsoft.com

Thursday, 20 October 2022

Visualize and monitor Azure & hybrid networks with Azure Network Watcher

There is a critical need for increased visibility and control over the operational state of complex networks running sophisticated workloads. Multi-cloud and hybrid network environments power new demands of remote work, 5G/Edge connectivity, microservices based workloads, and increased cloud adoption. The advent of the cloud has added agility, cost benefits, and brought along the need for management of the infrastructure. Management and monitoring of the network underlying these complex applications plays a key role in ensuring end-user satisfaction.

Azure Network Watcher provides an entire suite of tools to visualize, monitor, diagnose, and troubleshoot network issues across Azure and Hybrid cloud environments. Network Watcher enables customers to detect anomalies across Azure and hybrid networks with comprehensive wide coverage, through a guided and intuitive drilled-down experience. Network Watcher helps customers monitor, manage, and understand their own networks for performance, connectivity, security, and compliance issues and furthermore, empowers customers to troubleshoot efficiently with actionable insights and proactive alerting, thus effectively reducing the mean time to resolve network issues.

Azure Network Watcher, Azure Exam, Azure Tutorial and Materials, Azure Certification, Azure Career, Azure Skills, Azure Jobs, Azure Materials

The following new feature enhancements across Network Watcher suite aim to provide timely and complete visibility and actionable insights to customers of their hybrid networks in a manner that is easily accessible, readily usable, and reliable.

Visualize resource and network health with Topology


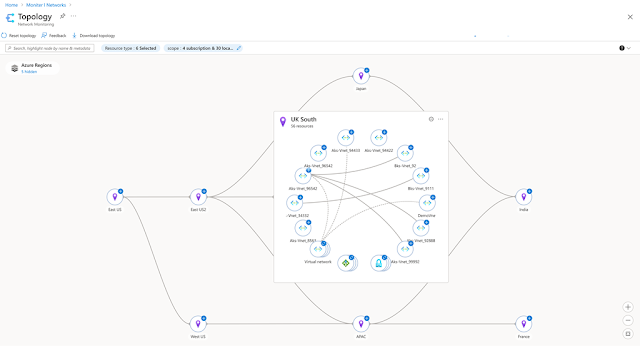
Topology enables users to quickly acquire system context, comprehend state, and troubleshoot issues efficiently by visualizing the resources in a network. It offers a visually connected experience for monitoring and managing inventory.

This new topology experience in Azure, which replaces the Network Watcher topology, will enable customers to create a consistent and dynamic topology across multiple subscriptions, regions, and resource groups (RGs)—comprising of numerous resources.

Azure Network Watcher, Azure Exam, Azure Tutorial and Materials, Azure Certification, Azure Career, Azure Skills, Azure Jobs, Azure Materials

Allowing deep dives into the customer’s environment, Topology lets users drill down from regions, VNETs to subnets, and resource view diagram of resources supported in Azure.

Stitching the end-to-end monitoring and diagnostics story for all Network Monitoring needs, topology offers the capability to run Next Hop directly from a VM selected in the topology.

Significant features available with this preview: 

◉ Multi-region and multi-subscription–dynamic drill-down visualization.
◉ Health status of resources using resource health (RHC) status.
◉ Diagnostics tool Next Hop integration.
◉ Resource view diagram for all supported resources.

Monitor connectivity using Azure Monitor Agent with Connection Monitor


Integration of Azure Monitor Agent’s support consolidates multi-monitoring agents into a single connectivity monitoring agent in Azure Network Watcher’s Connection Monitor.

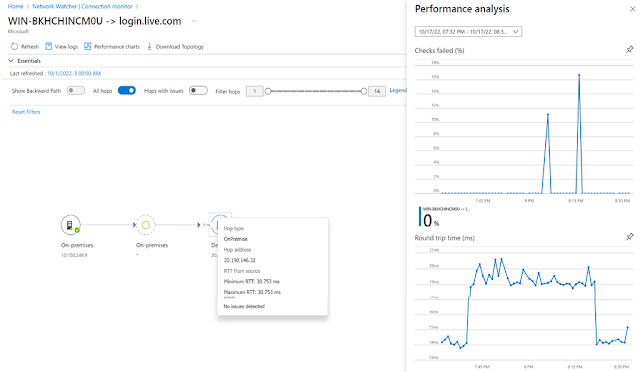
Connection Monitor, a multi-agent solution, monitors connectivity at regular intervals across Azure and Hybrid endpoints and provides aggregated data for packet loss, latency, and status codes over TCP, ICMP, and HTTP(s) pings.

Azure Network Watcher, Azure Exam, Azure Tutorial and Materials, Azure Certification, Azure Career, Azure Skills, Azure Jobs, Azure Materials

Connection Monitor helps you troubleshoot network issues with faster alerts for lack of connectivity or reachability to the endpoints. The unified topology rendered provides a complete end-to-end visualization of the network path from source to destination, with actionable insights.

This agent integration enhancement addresses connectivity monitoring logs and metrics data collection needs across Azure and ARC-enabled on-premises machines, thus eliminating the overhead of management and enablement of multiple monitoring agents. Additionally, Azure Monitor Agent provides enhanced security and performance capabilities, effective cost savings, and ease of troubleshooting with simpler management of data collection. With this support, dependency on the soon-to-be-retired Log Analytics agent is eliminated, while increasing the coverage for on-premises machines with support for ARC-enabled endpoints.

Significant features available with preview:

◉ Connectivity monitoring support for ARC-enabled on-premises endpoints.
◉ Simpler management of monitoring extension.
◉ One agent for monitoring Azure and non-Azure endpoints.
◉ Enhanced security through Managed Identity and Azure Active Directory (Azure AD) tokens.

Source: microsoft.com

Thursday, 6 October 2022

Azure Firewall Basic now in preview

Organizations are experiencing an increase in both the volume and sophistication of cyberattacks with the acceleration of digital transformation and the increase in hybrid work. While organizations of all sizes face similar security risks, cybersecurity is rapidly becoming a top concern for small and medium businesses (SMBs) with the shift to remote work and new digital business models. SMBs are particularly vulnerable as they are faced with budget constraints and gaps in specialized security skills. In a recent research study, over 60 percent of small businesses experienced a cyberattack and were left unable to operate.

Microsoft is constantly innovating to help secure customers’ digital assets in an evolving threatened landscape and help SMB customers with their cloud adoption journey. Today, we are excited to announce the preview of Azure Firewall Basic.

Azure Firewall Basic is a new SKU of Azure Firewall designed to meet the needs of SMBs by providing enterprise-grade protection of their cloud environment at an affordable price point. It is a cloud-native, highly available, stateful firewall as a service offering that enables customers to centrally govern and log all of their traffic flows with essential capabilities at scale.

Cost-effective, enterprise-grade security built for SMBs


Azure Firewall Basic includes Layer 3–Layer 7 filtering and alerts on malicious traffic with built-in threat intelligence from Microsoft Threat Intelligence. With tight integration with other Azure services, such as Azure Monitor, Azure Events Hub, Microsoft Sentinel, and Microsoft Defender for Cloud, you can gain more visibility into your environment and identify and respond to threats quicker.

Key features of Azure Firewall Basic


Comprehensive, cloud-native network firewall security.

◉ Network and application traffic filtering.
◉ Threat intelligence to alert on malicious traffic.
◉ Built-in high availability.
◉ Seamless integration with other Azure services.

Simple setup and easy to use.

◉ Set up in just a few minutes.
◉ Automate deployment (deploy as code).
◉ Zero maintenance with automatic updates.
◉ Central management via Azure Firewall Manager.

Cost-effective.

◉ Designed to deliver essential, cost-effective Firewall protection for your resources within your virtual network.

Azure Firewall Basic, Azure Exam, Azure Career, Azure Skill, Azure Jobs, Azure Tutorial and Materials

Choosing the right Azure Firewall SKU to meet your needs


Azure Firewall now supports three different SKUs to cater to a wide range of customer use cases and preferences.

◉ Azure Firewall Premium is recommended to secure highly sensitive applications (such as payment processing). It supports advanced threat protection capabilities like malware and TLS inspection.

◉ Azure Firewall Standard is recommended for customers looking for Layer 3–Layer 7 firewall and needs auto-scaling to handle peak traffic periods of up to 30 Gbps. It supports enterprise features like threat intelligence, DNS proxy, custom DNS, and web categories.

◉ Azure Firewall Basic is recommended for SMB customers with throughput needs of less than 250 Mbps.

Let’s take a closer look at the features across the three Azure Firewall SKUs.


Azure Firewall Basic pricing


Similar to the Standard and Premium SKUs, Azure Firewall Basic pricing includes both deployment and data processing charges.

Source: microsoft.com

Tuesday, 4 October 2022

Advancing anomaly detection with AIOps—introducing AiDice

In Microsoft Azure, we invest tremendous efforts in ensuring our services are reliable by predicting and mitigating failures as quickly as we can. In large-scale cloud systems, however, we may still experience unexpected issues simply due to the massive scale of the system. Given this, using AIOps to continuously monitor health metrics is fundamental to running a cloud system successfully, as we have shared in our earlier posts. First, we shared more about this in Advancing Azure service quality with artificial intelligence: AIOps. We also shared an example deep dive of how we use AIOps to help Azure in the safe deployment space in Advancing safe deployment with AIOps. Today, we share another example, this time about how AI is used in the field of anomaly detection. Specifically, we introduce AiDice, a novel anomaly detection algorithm developed jointly by Microsoft Research and Microsoft Azure that identifies anomalies in large-scale, multi-dimensional time series data. AiDice not only captures incidents quickly, it also provides engineers with important context that helps them diagnose issues more effectively, providing the best experience possible for end customers.

Why are AIOps needed for anomaly detection?


We need AIOps for anomaly detection because the data volume is simply too large to analyze without AI. In large-scale cloud environments, we monitor an innumerable number of cloud components, and each component logs countless rows of data. In addition, each row of data for any given cloud component might contain dozens of columns such as the timestamp, the hardware type of the virtual machine, the generation number, the OS version, the datacenter where the nodes hosting the virtual machine stay in, or the country. The structure of the data we have is essentially multi-dimensional time series data, which contains an exponential number of individual time series due to the various combinations of dimensions. This means that iterating through and monitoring every single time series is simply not practical—applying AIOps is necessary.

How did we approach this, before AiDice?


Before AiDice, the way we handled anomaly detection in large-scale, high-dimensional time series data was to conduct anomaly detection on a selected set of dimensions that were the most important. By focusing on a scoped subset, we would be able to detect anomalies within those combinations quickly. Once these anomalies were detected, engineers would then dive deeper into the issues, using pivot tables to drill down into the other dimensions not included to better diagnose the issue. Although this approach worked, we saw two key opportunities to improve the process. First, the old approach required a lot of manual effort by engineers to determine the exact pivot of anomalies. Second, the approach also limited the scope of direct monitoring by only allowing us to input a limited number of dimensions into our anomaly detection algorithms. Given these reasons, Microsoft Research and Azure worked together to develop AiDice, which improves both of these areas.

How do we approach this now with AiDice, and how does it work?


Now with AiDice, we can automatically localize pivots on time series data even if looking at dozens of dimensions at the same time. This allows us to add a lot more attributes, whether that be the hardware generation or hardware microcode, the OS version, or the networking agent version. Though this makes the search space much larger, AiDice encodes the problem as a combinatorial optimization problem, allowing it to search through the space more efficiently than traditional approaches. Brief details of AiDice are described below, but to see a full explanation of the algorithm, please see the paper published at the ESEC/FSE '20: 28th ACM Joint European Software Engineering Conference and Symposium on the Foundations of Software Engineering (ESEC/FSE 2020).

Part 1: AiDice algorithm—formulation as a search problem


The AiDice algorithm works by first turning the data into a search problem. Search nodes are formed by starting at a given pivot and building the relationships out to the neighbors. For example, if we take a node, "Country=USA, Datacenter=DC1, DiskType=SSD", we can form out the neighboring nodes by swapping, adding, or removing a dimension-value pair, as shown in the diagram below.

AIOps, Microsoft Azure, Microsoft Certification, Microsoft Career, Microsoft Skills, Microsoft Jobs, Microsoft Prep, Microsoft Preparation, Microsoft Tutorial and Materials

Part 2: AiDice algorithm—objective function


Next, the AiDice algorithm searches through the search space in a smart manner by maximizing an objective function that emphasizes two key components. First, the bigger the sudden burst or change in errors, the higher AiDice scores the objective function. Second, the higher the proportion of the errors that occur in this pivot in relation to the total number of errors, the higher AiDice scores the objective function. For example, if there are 5,000 total errors that occurred, it is more important to alert the user about the pivot that went from 3000 errors to 4000 errors than the pivot that went from 10 to 20 errors.

Part 3: Customization of alerts to reduce noise


Next, the alerts that AiDice produces need to be filtered and customized to be less noisy and more actionable since the results so far are optimized from a mathematical perspective but have not yet incorporated domain knowledge around the meaning of the input data. This step can vary widely depending on the nature of the input data, but an example could be that consecutive alerts that share the same error code may be grouped together to reduce the number of total alerts.

AiDice in action—an example


The following is a real example in which AiDice helped detect a real issue early on. The details are altered for confidentiality reasons.

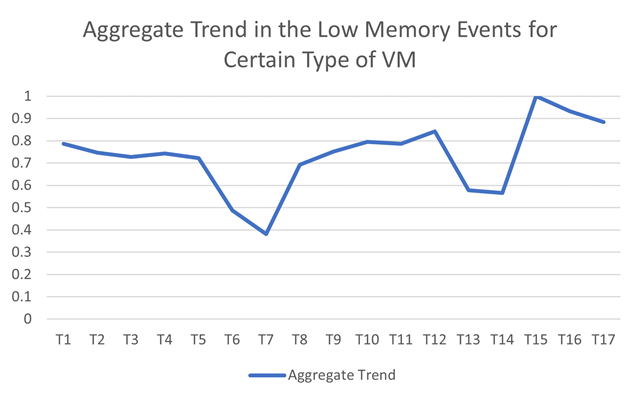
◉ We applied AiDice to monitor low memory error events in a certain type of virtual machine with more than a dozen dimensions of attribute information alongside the fault count, including the region, the datacenter location, the cluster, the build, the RAM, or the event type.

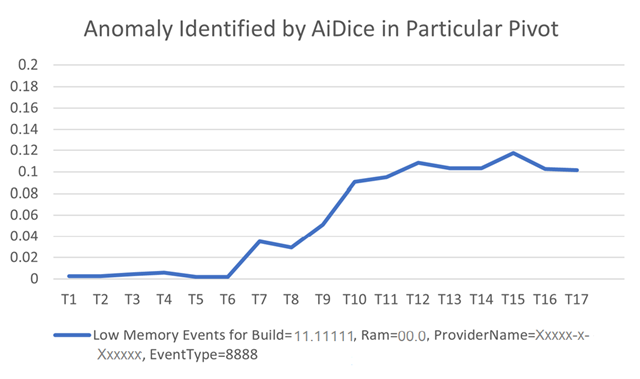
◉ AiDice identified an increase in the number of low memory events on distinct nodes in a particular pivot, which indicated a memory leak.
    ◉ Build=11.11111, Ram=00.0, ProviderName=Xxxxx-x-Xxxxxx, EventType=8888 (details have been altered for privacy).

◉ When looking at the aggregate trend, this issue is hidden and without AiDice it would take manual effort to detect the exact location of the issue (see graphs below, data normalized for privacy).

◉ The engineer responsible for the ticket looked at the alert and some example cases shown in the alerts to quickly able figure out what was going on.

AIOps, Microsoft Azure, Microsoft Certification, Microsoft Career, Microsoft Skills, Microsoft Jobs, Microsoft Prep, Microsoft Preparation, Microsoft Tutorial and Materials

AIOps, Microsoft Azure, Microsoft Certification, Microsoft Career, Microsoft Skills, Microsoft Jobs, Microsoft Prep, Microsoft Preparation, Microsoft Tutorial and Materials

In this real-world example, AiDice was able to detect an issue in a dimension combination that was causing a particular error type in an automatic fashion, quickly and efficiently. Soon after, the memory leak was discovered and Azure engineers were able to mitigate the issue.

Looking forward


Looking ahead, we hope to improve AiDice to make Azure even more resilient and reliable. Specifically, we plan to:

◉ Support additional scenarios in Azure: AiDice is being applied to many scenarios in Azure already, but the algorithm has room to improve with respect to the types of metrics it can operate on. Microsoft Azure and the Microsoft Research team are working together to support more metric scenarios.

◉ Prepare additional data feeds in Azure for AiDice: In addition to upgrading the AiDice algorithm itself to support more scenarios, we are also working to add supporting attributes to certain data sources to fully leverage the power of AiDice.

Source: microsoft.com

Tuesday, 28 June 2022

MLOps Blog Series Part 1: The art of testing machine learning systems using MLOps

Testing is an important exercise in the life cycle of developing a machine learning system to ensure high-quality operations. We use tests to confirm that something functions as it should. Once tests are created, we can run them automatically whenever we make a change to our system and continue to improve them over time. It is a good practice to reward the implementation of tests and identify sources of mistakes as early as possible in the development cycle to prevent rising downstream expenses and lost time.

In this blog, we will look at testing machine learning systems from a Machine Learning Operations (MLOps) perspective and learn about good case practices and a testing framework that you can use to build robust, scalable, and secure machine learning systems. Before we delve into testing, let’s see what MLOps is and its value to developing machine learning systems.

Azure MLOps, Azure Exam Prep, Azure Tutorial and Material, Azure Guides, Azure Career, Azure Skills, Azure Jobs, Azure Preparation, Azure Exam Preparation
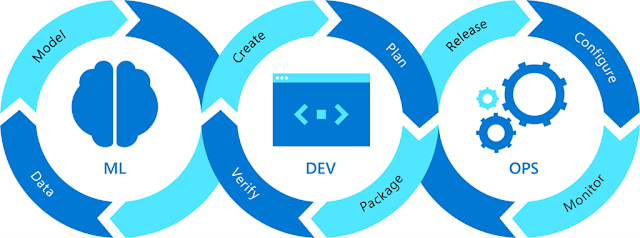
Figure 1: MLOps = DevOps + Machine Learning.

Software development is interdisciplinary and is evolving to facilitate machine learning. MLOps is a process for fusing machine learning with software development by coupling machine learning and DevOps. MLOps aims to build, deploy, and maintain machine learning models in production reliably and efficiently. DevOps drives machine learning operations. Let’s look at how that works in practice. Below is an MLOps workflow illustration of how machine learning is enabled by DevOps to orchestrate robust, scalable, and secure machine learning solutions.

Azure MLOps, Azure Exam Prep, Azure Tutorial and Material, Azure Guides, Azure Career, Azure Skills, Azure Jobs, Azure Preparation, Azure Exam Preparation
Figure 2: MLOps workflow.
 
The MLOps workflow is modular, flexible, and can be used to build proofs of concept or operationalize machine learning solutions in any business or industry. This workflow is segmented into three modules: Build, Deploy, and Monitor. Build is used to develop machine learning models using an machine learning pipeline. The Deploy module is used for deploying models in developer, test, and production environments. The Monitor module is used to monitor, analyze, and govern the machine learning system to achieve maximum business value. Tests are performed primarily in two modules: the Build and Deploy modules. In the Build module, data is ingested for training, the model is trained using ingested data, and then it is tested in the model testing step.

1. Model testing: In this step, we evaluate the performance of the trained model on a separated set of data points named test data (which was split and versioned in the data ingestion step). The inference of the trained model is evaluated according to selected metrics as per the use case. The output of this step is a report on the trained model's performance. In the Deploy module, we deploy the trained models to dev, test, and production environments, respectively. First, we start with application testing (done in dev and test environments).

2. Application testing: Before deploying an machine learning model to production, it is vital to test the robustness, scalability, and security of the model. Hence, we have the "application testing" phase, where we rigorously test all the trained models and the application in a production-like environment called a test, or staging, environment. In this phase, we may perform tests such as A/B tests, integration tests, user acceptance tests (UAT), shadow testing, or load testing.

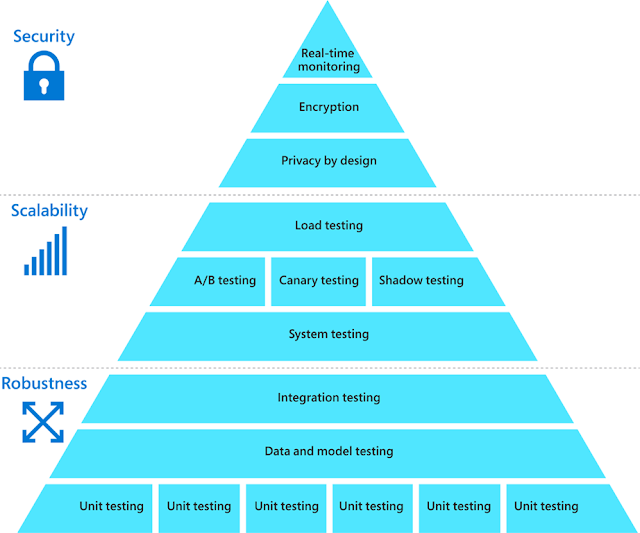
Below is the framework for testing that reflects the hierarchy of needs for testing machine learning systems.

Azure MLOps, Azure Exam Prep, Azure Tutorial and Material, Azure Guides, Azure Career, Azure Skills, Azure Jobs, Azure Preparation, Azure Exam Preparation
Figure 3: Hierarchy of needs for testing machine learning systems.

One way to think about machine learning systems is to consider Maslow's hierarchy of needs. Lower levels of a pyramid reflect “survival,” and the true human potential is unleashed only after basic survival and emotional needs are met. Likewise, tests that inspect robustness, scalability, and security ensure that the system not only performs at the basic level but reaches its true potential. One thing to note is that there are many additional forms of functional and nonfunctional testing, including smoke tests (rapid health checks) and performance tests (stress), but they may all be classified as system tests.

Source: microsoft.com

Saturday, 25 June 2022

Azure Orbital Ground Station as Service extends life and reduces costs for satellite operators

Azure Orbital Ground Station, Station as-a-Service (GSaaS), Microsoft Career, Microsoft Skills, Microsoft Jobs, Microsoft Certification, Microsoft Tutorial and Material, Microsoft Guide

How can Microsoft empower satellite operators to focus on their mission and enable them to continue the operation of their satellites, without making capital investments in their ground infrastructure?

To answer that question, Microsoft worked alongside the National Oceanic and Atmospheric Administration (NOAA), and our partner Xplore, to demonstrate how the commercial cloud can provide satellite mission management for NOAA’s legacy polar satellites (NOAA-18)—extending the mission life of these satellites while reducing the cost of operation through Azure Orbital Ground Station as-a-Service (GSaaS).

Partnering with the National Oceanic and Atmospheric Administration and Xplore

The initiative was part of a year-long cooperative research and development agreement (CRADA) with NOAA, where we worked together to determine the ability of the Azure Orbital platform to connect and downlink data from NOAA satellites. NOAA also tested the ability of Microsoft Azure to comply with specified security controls in a rapid and effective manner. Our cloud-based solutions performed successfully across all measures.

Partners are central to Microsoft’s approach to space, and they played a key role in this project. As part of the CRADA, we leveraged our partner network to bring together Azure Orbital with Xplore’s Major Tom mission control software platform. This approach enabled NOAA to transmit commands to the NOAA-18 spacecraft and verify the receipt of these commands. This test was conducted in real-time, and data was flowing bi-directionally with the NOAA-18 satellite.

Commercial technology enabled the rapid demonstration of these innovative capabilities. Xplore was able to move quickly to bring functions of NOAA’s heritage space system architecture to the Azure cloud through their Major Tom platform. This highlights the power of Azure as a platform to bring together Azure Orbital as the ground station, Major Tom to provide the mission control software for commanding and telemetry viewing, and the NOAA operators to monitor the scenarios.

This successful demonstration shows that the Azure Orbital GSaaS, and the partner network it brings together, enables sustainable outcomes for satellite operators. Our work with NOAA is just the beginning of the journey. We look forward to partnering with additional satellite operators to help them reduce their infrastructure management costs, lower latency, increase capacity and resiliency, and empower their missions through the power of Azure Orbital GSaaS and the Azure cloud.

Learn more about Azure Orbital and Azure Space

To learn more about Azure Orbital GSaaS, visit our product page, or take a look at the session with Microsoft Mechanics, which goes into more detail on how we connect space satellites around the world and bring earth observational data into Azure for analytics via Microsoft and partner ground stations. We demonstrate how it works and how it fits into Microsoft’s strategy with Azure Space to bring cloud connectivity everywhere on earth and to make space satellite data accessible for everyday use cases.

More broadly, Azure Space marks the convergence between global satellite constellations and the cloud. As the two join together, our purpose is to bring cloud connectivity to even the most remote corners of the earth, connect to satellites, and harness the vast amount of data collected from space. This can help solve both long-term trending issues affecting the earth like climate change, or short-term real-time issues such as connected agriculture, monitoring and controlling wildfires, or identifying supply chain bottlenecks.

Source: microsoft.com

Saturday, 11 June 2022

Achieve seamless observability with Dynatrace for Azure

As adoption of public cloud grows by leaps and bounds, organizations want to leverage software and services that they love and are familiar with as a part of their overall cloud solution. Microsoft Azure enables customers to host their apps on the globally trusted cloud platform and use the services of their choice by closely partnering with popular SaaS offerings. Dynatrace is one such partner that provides deep cloud observability, advanced AIOps, and continuous runtime application security capabilities on Azure.

“Deep and broad observability, runtime application security, and advanced AI and automation are key for any successful cloud transformation. Through the Dynatrace platform’s integration with Microsoft Azure, customers will now have immediate access to these capabilities. This integration will deliver answers and intelligent automation from the massive amount of data generated by modern hybrid-cloud environments, enabling flawless and secure digital interactions.”—Steve Tack, SVP Product Management, Dynatrace.

Modern cloud-native environments are complex and dynamic. When failures occur, development teams need deep visibility into the systems to get to the root cause of the issues and understand the impact of potential fixes. Good observability solutions such as Dynatrace for Azure not only enable you to understand what is broken, but also provide the ability to proactively identify and resolve issues before they impact your customers. Currently, if you want to leverage Dynatrace for observability, you go through a complex process of setting up credentials, Event Hubs, and writing custom code to send monitoring data from Azure to Dynatrace. This is often time-consuming and hard to troubleshoot when issues occur. To alleviate this customer pain, we worked with Dynatrace to create a seamlessly integrated solution on Azure that’s now available on the Azure Marketplace.

Dynatrace’s integration provides a unified experience with which you can:

1. Create a new Dynatrace environment in the cloud with just a few clicks. Dynatrace SaaS on Azure is a fully managed offering that takes away the need to set up and operate infrastructure.

2. Seamlessly ship logs and metrics to Dynatrace. Using just a few clicks, configure auto-discovery of resources to monitor and set up automatic log forwarding. Configuring Event Hubs and writing custom code to get monitoring data is now a thing of the past.

3. Easily install Dynatrace OneAgent on virtual machines (VMs) and App Services through a single click. OneAgent continuously monitors the health of host and processes and automatically instruments any new processes.

4. Use single sign-on to access the Dynatrace SaaS portal—no need to remember multiple credentials and log in separately.

5. Get consolidated billing for the Dynatrace service through Azure Marketplace.

“Microsoft is committed to providing a complete and seamless experience for our customers on Azure. Enabling developers to use their most loved tools and services makes them more productive and efficient. Azure native integration of Dynatrace makes it effortless for developers and IT administrators to monitor their cloud applications with the best of Azure and Dynatrace together.”—Balan Subramanian, Partner Director of Product Management, Azure Developer Experiences.

Get started with Dynatrace for Azure

Let’s now look at how you can easily set up and configure Dynatrace for Azure:

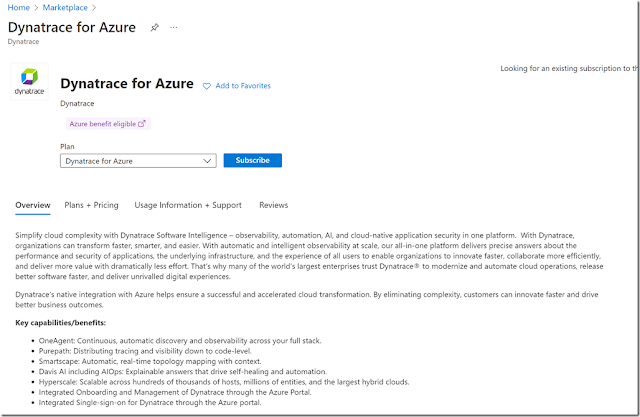
Acquire the Dynatrace for Azure offering: You can find and acquire the solution from the Azure Marketplace.

Azure, Azure Exam, Azure Exam Prep, Azure Certification, Azure Certification Exam, Azure Tutorial and Materials, Azure Career, Azure Skills, Azure Jobs, Azure News

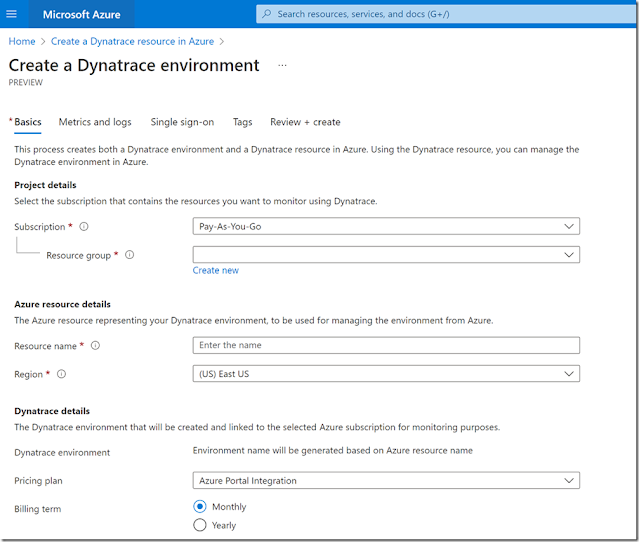
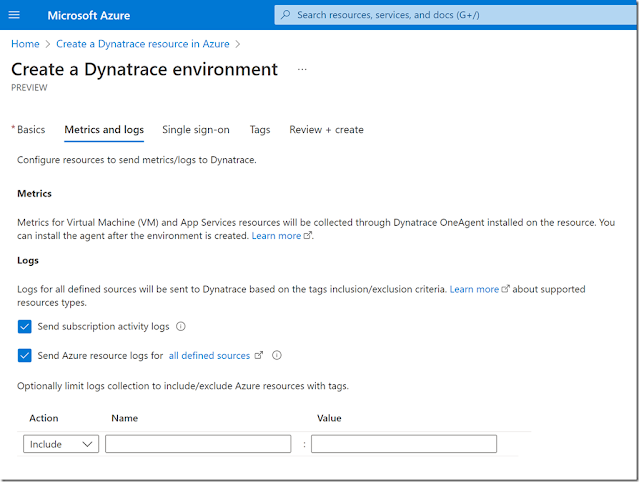
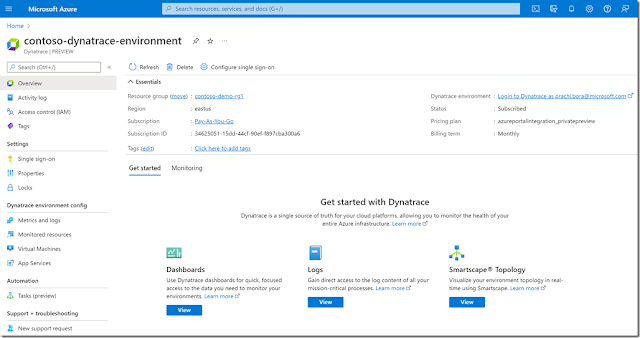
Create a Dynatrace resource in Azure portal: Once the Dynatrace solution is acquired, you can seamlessly create a Dynatrace resource using the Azure portal. Using the Dynatrace resource, you can configure and manage your Dynatrace environments within the Azure portal.

Azure, Azure Exam, Azure Exam Prep, Azure Certification, Azure Certification Exam, Azure Tutorial and Materials, Azure Career, Azure Skills, Azure Jobs, Azure News

Configure log forwarding: Configure which Azure resources send logs to Dynatrace, using the familiar concept of resource tags.

Azure, Azure Exam, Azure Exam Prep, Azure Certification, Azure Certification Exam, Azure Tutorial and Materials, Azure Career, Azure Skills, Azure Jobs, Azure News

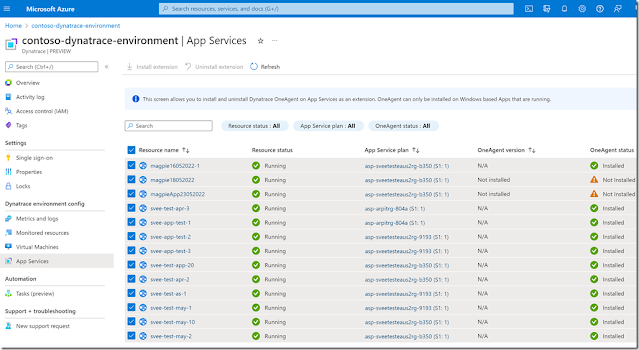
Install Dynatrace OneAgent: With a single click, you can install Dynatrace OneAgent on multiple VMs and App Services.

Azure, Azure Exam, Azure Exam Prep, Azure Certification, Azure Certification Exam, Azure Tutorial and Materials, Azure Career, Azure Skills, Azure Jobs, Azure News

Access Dynatrace native service for Azure with single sign-on: Use the single sign-on experience to effortlessly access dashboards, Smartscape® topology visualization, log content, and more on the Dynatrace portal.

Azure, Azure Exam, Azure Exam Prep, Azure Certification, Azure Certification Exam, Azure Tutorial and Materials, Azure Career, Azure Skills, Azure Jobs, Azure News

Source: microsoft.com

Tuesday, 25 January 2022

Elastic and Microsoft Azure: Unified Observability for Spring Boot applications

Today, we are announcing the availability of Elastic integrations for unified observability of Spring Boot applications on Azure. You can seamlessly ship Microsoft Azure Spring Cloud logs and metrics into Elastic, instrument Spring Boot applications, and monitor every step of your cloud journey. You also get a holistic view across Spring Boot applications and other logs and metrics in your cloud and on-premises environments.

Over the past two years, we worked with many enterprise customers to learn about the scenarios they face. Many of these customers have thousands of Spring Boot applications running in on-premises data centers. As they migrate these applications to the cloud, they need to aggregate logs and metrics from these applications and instrument them for application performance monitoring (APM) using solutions their developers are familiar with and have been using for years. In addition, they must ensure continuity for existing server-side software that are already shipping logs and metrics and are pre-instrumented for end-to-end monitoring using systems like Elastic. You can gain deeper application visibility, reduce the time spent on root cause analysis, and provide a consistent customer experience in your web and mobile applications. Learnings from a 2021 survey also indicated that “end-to-end monitoring” is the second biggest challenge DevOps and IT managers face as they migrate Spring Boot applications to the cloud. With the integration of Azure Spring Cloud logs and metrics in Elastic, you can streamline your journey and easily instrument your Spring Boot applications for unified observability.

Microsoft Azure, Microsoft Azure Exam, Microsoft Azure Career, Microsoft Azure Skills, Microsoft Azure Job, Azure Preparation, Announcements, Web Developer, Cloud Strategy, Monitoring, Azure DevOps, Migration
Figure 1: Video screenshot with dashboards showing observability for Spring Boot applications using Elastic

Elastic can now seamlessly ingest logs and metrics from Microsoft Azure Spring Cloud so that DevOps and SREs can monitor their Spring Boot applications—whether in the cloud, on-premises, or in hybrid environments—and remove monitoring silos to increase operational efficiency and developer productivity. DevOps and SREs can monitor both Spring Boot logs and application metrics across all environments by automatically shipping them to Elastic. Teams can also correlate and add context to their Spring data with other observability data sets across their environments for holistic end-to-end monitoring.

"Microsoft is committed to making it easier for customers to modernize their Java applications in the cloud. The expanded native integration of Elastic on Azure includes support for Azure Spring Cloud that enables customers to simply achieve end-to-end observability of their Spring Boot applications."—Julia Liuson, President, Developer Division, Microsoft

Shipping Azure Spring Cloud logs to Elastic


Native integration makes it seamless to ship logs to the Elastic Observability solution. Once data is shipped into Elastic, you can jumpstart analysis in minutes with turnkey visualizations and dashboards.

Microsoft Azure, Microsoft Azure Exam, Microsoft Azure Career, Microsoft Azure Skills, Microsoft Azure Job, Azure Preparation, Announcements, Web Developer, Cloud Strategy, Monitoring, Azure DevOps, Migration
Figure 2: Diagnostic Setting blade for Azure Spring Cloud Service

Instrumenting Spring Boot applications


Run a "provisioning" automation for a completely hands-off experience for instrumenting and monitoring any new applications that you create and deploy using Elastic’s Terraform or ARM template. Or you can run it on-demand using the Azure command-line interface (CLI) for greater flexibility and control.

Microsoft Azure, Microsoft Azure Exam, Microsoft Azure Career, Microsoft Azure Skills, Microsoft Azure Job, Azure Preparation, Announcements, Web Developer, Cloud Strategy, Monitoring, Azure DevOps, Migration
Figure 3: Example of setting up Elastic instrumentation using the Azure CLI (command-line interface)

Analyzing Spring Boot application performance


After instrumenting and shipping logs from your Spring Boot application, you can use Elastic Observability to monitor, analyze, and search your data to keep your applications performing.

You can also use the out-of-the-box Azure Spring Cloud dashboards within Elastic Observability to gain instant insights from your Azure Spring Cloud logs.

Microsoft Azure, Microsoft Azure Exam, Microsoft Azure Career, Microsoft Azure Skills, Microsoft Azure Job, Azure Preparation, Announcements, Web Developer, Cloud Strategy, Monitoring, Azure DevOps, Migration
Figure 4: Out-of-the-box dashboards for Azure Spring Cloud Service logs in Elastic Observability

With Elastic application performance monitoring (APM), you can analyze and search your application performance data.

Microsoft Azure, Microsoft Azure Exam, Microsoft Azure Career, Microsoft Azure Skills, Microsoft Azure Job, Azure Preparation, Announcements, Web Developer, Cloud Strategy, Monitoring, Azure DevOps, Migration
Figure 5: Service Map for customer-service from Spring Petclinic Application

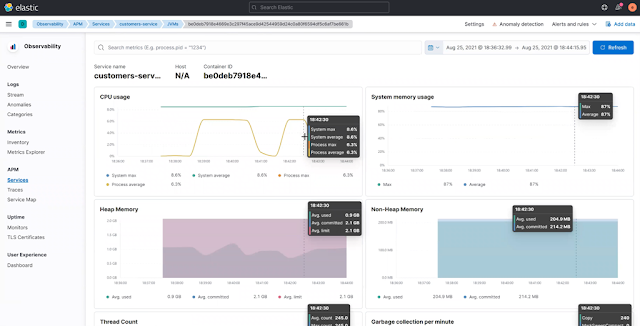
You can also use Elastic APM to look at Java Virtual Machine (JVM) metrics to understand heap memory usage, system memory usage, CPU usage, and other metrics that help you make evidence-based capacity planning decisions.

Microsoft Azure, Microsoft Azure Exam, Microsoft Azure Career, Microsoft Azure Skills, Microsoft Azure Job, Azure Preparation, Announcements, Web Developer, Cloud Strategy, Monitoring, Azure DevOps, Migration
Figure 6: JVM metrics in Elastic APM for customers-service

Utilizing the distributed tracing capabilities of Elastic APM, you can drill further into the performance of your applications to understand which transactions impact your customers the most and wherein those transactions is the most time being spent.

Microsoft Azure, Microsoft Azure Exam, Microsoft Azure Career, Microsoft Azure Skills, Microsoft Azure Job, Azure Preparation, Announcements, Web Developer, Cloud Strategy, Monitoring, Azure DevOps, Migration
Figure 7: Distributed tracing in Elastic APM for customers-service's GET owners operation

Machine learning automatically detects anomalies


With Elastic’s built-in machine learning capabilities, extracting new insights from your Azure Spring Cloud data is as simple as clicking a button—making machine learning truly operational.

The Elastic Stack processes data upon ingestion, ensuring that you have the metadata you need to identify root causes or add context to any event. Built-in tools like Data Visualizer help you find the jobs you're looking for and identify fields in your data that would pair well with machine learning.

You can derive actionable insights from your logs and APM data with the rich alerting and anomaly detection capabilities within Elastic Observability. For example, you can uncover irregular log rates or unusual behavior in the response times of your applications in Azure Spring Cloud

Microsoft Azure, Microsoft Azure Exam, Microsoft Azure Career, Microsoft Azure Skills, Microsoft Azure Job, Azure Preparation, Announcements, Web Developer, Cloud Strategy, Monitoring, Azure DevOps, Migration
Figure 8: Anomaly Explorer in Elastic

Use the same logs to stop threats at cloud scale


Since Elastic offers a common schema and single repository, the same observability data from Spring applications and other data sets can also be used for extended detection and response (XDR) to drive mean time to detection towards zero. Elastic Security brings together security information and event management (SIEM) and endpoint security, allowing organizations to ingest and retain large volumes of data from diverse sources, store and search data for longer, and augment threat hunting with detections and machine learning.

Focus on customer value while we keep the lights on


The native integration of Elastic in Azure is the easiest and fastest way to get started with Elastic on Azure. Quickly ship your Azure Spring Cloud logs and APM data to Elastic, access any type of data, from anywhere, when you need it the most—whether your data is on-prem, or in multi-cloud or hybrid cloud environments. This holistic view helps streamline migrating your Spring Boot applications to the cloud. Plus, Elastic Cloud handles the security, maintenance, and upkeep, allowing you to drive your business forward with increased visibility, improved operations, and cyber resilience.

Build your solutions and monitor them today


Azure Spring Cloud is jointly built, operated, and supported by Microsoft and VMware. It is a fully managed service for Spring Boot applications that abstracts away the complexity of infrastructure and Spring Cloud middleware management, so you can focus on building your business logic and let Azure take care of dynamic scaling, patches, security, compliance, and high availability. With a few steps, you can provision Azure Spring Cloud, create applications, deploy, and scale Spring Boot applications, and start monitoring in minutes. We will continue to bring more developer-friendly and enterprise-ready features to Azure Spring Cloud. We would love to hear how you are building impactful solutions using Azure Spring Cloud.

Source: microsoft.com

Tuesday, 7 September 2021

Monitor Spring Boot applications end-to-end using Dynatrace

Today, we are announcing the integration of the Dynatrace Software Intelligence Platform in Azure Spring Cloud.

Over the past 18 months, we worked with many enterprise customers to learn about the scenarios they face. Many of these customers have thousands of Spring Boot applications running in on-premises data centers. As they migrate these applications to the cloud, they need to instrument them for application performance monitoring (APM) using solutions their developers are familiar with and have been using for years. In addition, they must ensure continuity for desktop and mobile applications that are already pre-instrumented for end-to-end monitoring using agents like Dynatrace OneAgent, which automatically discovers and maps all applications, microservices, and infrastructure as well as any dependencies in dynamic hybrid, multi-cloud environments. With the integration of Dynatrace OneAgent in Azure Spring Cloud, you can continue your journey and easily instrument your Spring Boot applications with Dynatrace.

Continue your Dynatrace journey. Most organizations that deploy Spring Boot applications today share a similar goal: maximize the benefits of running Spring Boot applications at virtually any scale, using automation and APM. While Azure Spring Cloud excels at abstracting away much of the toil associated with managing containerized workloads, the challenge of monitoring and maintaining the performance and health of these applications, or of troubleshooting issues when they occur, can be daunting—especially as organizations deploy these applications at massive scale. To help you succeed and continue your Dynatrace journey, we integrated and upgraded your ability to instrument, monitor, and deliver observability using Dynatrace OneAgent across your Azure Spring Cloud instances. That begins with setting up instrumentation quickly and easily. Then you can analyze the performance and health of your applications, JVMs, transactions, and more.

“For Liantis, true hybrid monitoring across both our on-premises and cloud-based Spring Boot microservices is key, but we also require simple and straightforward implementation—which is in line with the true Azure Spring Cloud philosophy of abstracting complexity. Doing so allows Liantis to spend more time on developing innovative applications, rather than building and operating infrastructure, which enables us to deliver true value for our customers and employees. Building on our in-house expertise with both Spring and Dynatrace technology, combined with our previous investments, the Dynatrace integration with Azure Spring Cloud was the obvious choice for Liantis.”—Nicolas Van Kerschaver, CIO, Liantis

“Being able to scale is critical for today’s digital business, as organizations have made the shift to cloud-native workloads and microservices. While cloud-native technologies and microservices have tremendous advantages, dynamic environments bring complexity that makes it difficult to understand the relationships and dependencies across an organization’s cloud ecosystem. Dynatrace’s strategic partnership with Microsoft allows us to extend the impact of our automatic and intelligent observability even further to accelerate digital transformation.  Through the Dynatrace integration with Azure Spring Cloud, we are enabling full visibility into application data for Spring Boot applications, which means more time innovating and a better product for end-users.”—Eric Horsman, Global Director of Strategic Alliances, Dynatrace

“At Microsoft, we are committed to helping our customers modernize their applications and innovate faster than ever before. By integrating a software intelligence solution like Dynatrace with Azure Spring Cloud, we can enable our customers with easy implementation of end-to-end observability, including automatic and continuous root-cause analysis, for their Spring Boot applications.”—Julia Liuson, Corporate Vice President, Developer Division, Microsoft
Azure Exam Prep, Azure Certification, Azure Preparation, Azure Career, Azure Guides, Azure Learning, Azure Materials
Watch the video above about how you can accelerate the transformation of Spring Boot applications with Microsoft Azure and Dynatrace.

Instrument your Spring Boot applications. Run a "provisioning" automation pipeline for a complete hands-off experience to instrument and monitor any new applications that you create and deploy—using Terraform or ARM Template. Or you can run it on-demand using the Azure CLI for greater flexibility and control.

az spring-cloud app update --name customers-service \
         --env DT_TENANT=<your-tenant> DT_TENANTTOKEN=<your-tenant-token> \
         DT_CONNECTION_POINT=<your-connection-point>

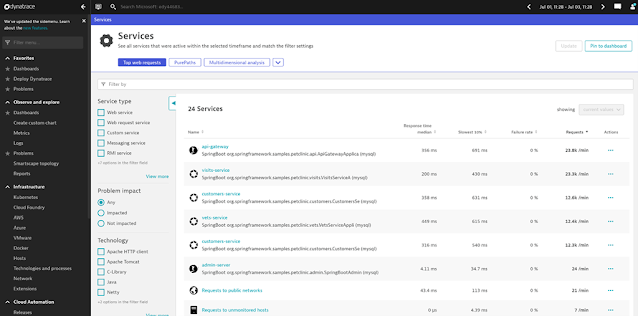
Automatic discovery and mapping of applications and their dependencies. To maintain real-time awareness in dynamic environments, Dynatrace automatically discovers and maps application components (including application servers, frameworks, and microservices), databases, messaging and eventing systems, and their relationships. In the view shown below, the Dynatrace Portal shows all the Spring Boot applications running in a production workload.

Azure Exam Prep, Azure Certification, Azure Preparation, Azure Career, Azure Guides, Azure Learning, Azure Materials
Figure 1: Shows all the Spring Boot applications running in a production workload

End-to-end observability of Spring Boot applications’ complete HTTP/S transactional behavior to understand the effect on business outcomes and user experiences. In the example view below, Dynatrace provides developers with all the transaction traces implemented in code without any code change to applications.

Azure Exam Prep, Azure Certification, Azure Preparation, Azure Career, Azure Guides, Azure Learning, Azure Materials
Figure 2: Shows transaction traces implemented in code without any code change to applications

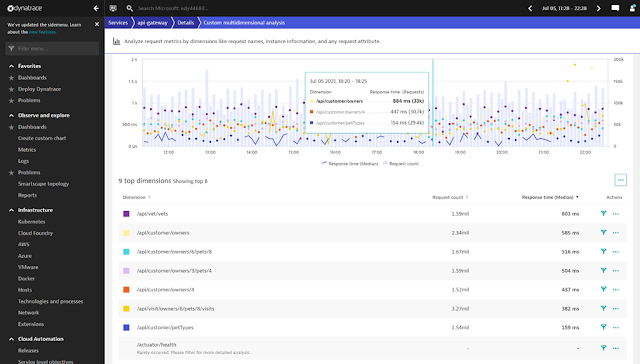
Endpoint monitoring, API monitoring, DB calls monitoring, end-user experience monitoring. Dynatrace captures all the database queries initiated by your Spring Boot applications, including Azure database services. In the example view below, Dynatrace Portal shows all the active REST API operations within a production workload.

Azure Exam Prep, Azure Certification, Azure Preparation, Azure Career, Azure Guides, Azure Learning, Azure Materials
Figure 3: Shows all the active REST API operations within a production workload

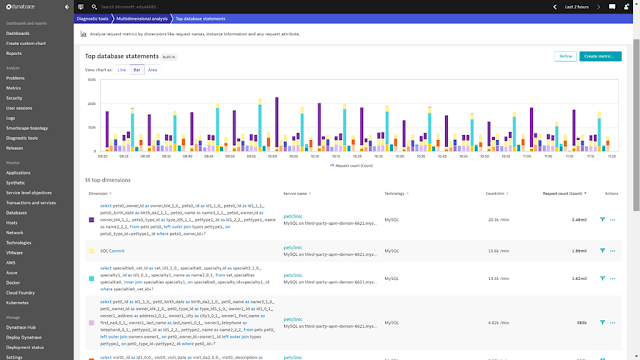
In the example view below, the Dynatrace Portal shows all the database queries initiated by a production workload.

Azure Exam Prep, Azure Certification, Azure Preparation, Azure Career, Azure Guides, Azure Learning, Azure Materials
Figure 4: Shows all the database queries initiated by a production workload

Root-cause and impact analysis of application performance problems and business outcomes for faster, more reliable incident resolution. Dynatrace provides deep-code level visibility with end-to-end traces and the integration provides AI-assisted problem detection and automatic root-cause analysis allowing you to stay on top of your deployments and distinguish between healthy and unhealthy applications.

Azure Exam Prep, Azure Certification, Azure Preparation, Azure Career, Azure Guides, Azure Learning, Azure Materials
Figure 5: Shows results from stack trace analysis

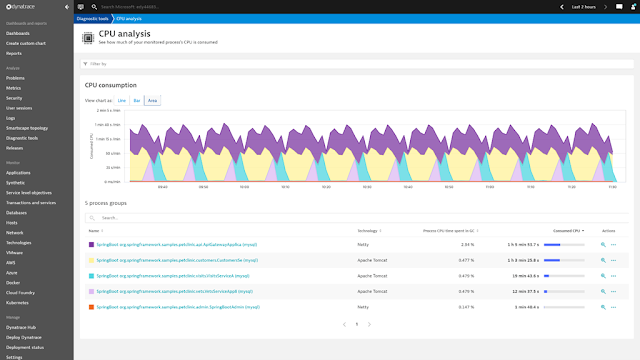
Detect anomalies in your Spring Boot application instances. Dynatrace passes the collected data through an AI engine for automated root cause analysis, code level hotspot analysis, top database queries and exception analysis. In the example screenshot below, Dynatrace automatically identifies code modules that are CPU intensive so that you do not have to dig through the data.

Azure Exam Prep, Azure Certification, Azure Preparation, Azure Career, Azure Guides, Azure Learning, Azure Materials
Figure 6: Code modules that are CPU intensive so that you do not have to dig through the data

You can find all the top database queries initiated, how expensive these queries are, and how many times these queries are called by applications. In the example screenshot below, Dynatrace shows top database queries initiated by a production workload.

Azure Exam Prep, Azure Certification, Azure Preparation, Azure Career, Azure Guides, Azure Learning, Azure Materials
Figure 7: Shows top database queries initiated by a production workload

All application code level exceptions are logged along with many details into the stack traces of where the exception occurred. In the example screenshot below, the Dynatrace portal shows the top exceptions thrown by a production workload.

Azure Exam Prep, Azure Certification, Azure Preparation, Azure Career, Azure Guides, Azure Learning, Azure Materials
Figure 8—shows the top exceptions thrown by a production workload.

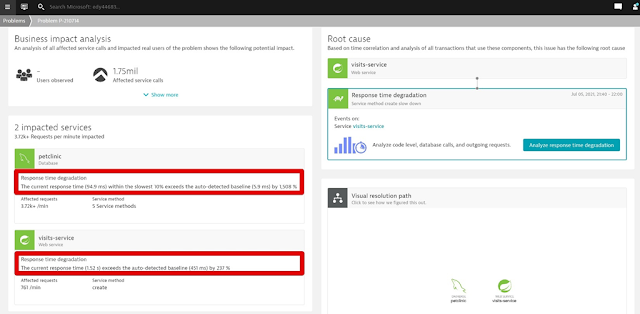
The Dynatrace Software Intelligence Platform automatically baselines all the performance metrics of Spring Boot applications. When the response times of an application increase beyond the auto-detected baseline, the platform creates an alert with information like how many response times have been breached from baselines. In the example screenshot below, Dynatrace shows response time degradation for a few services in a production workload.

Azure Exam Prep, Azure Certification, Azure Preparation, Azure Career, Azure Guides, Azure Learning, Azure Materials
Figure 9: Shows response time degradation for a few services in a production workload

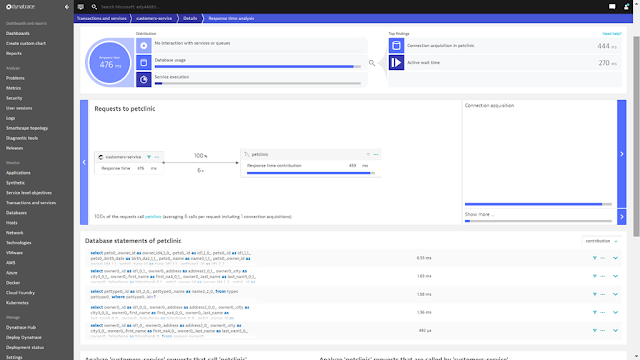
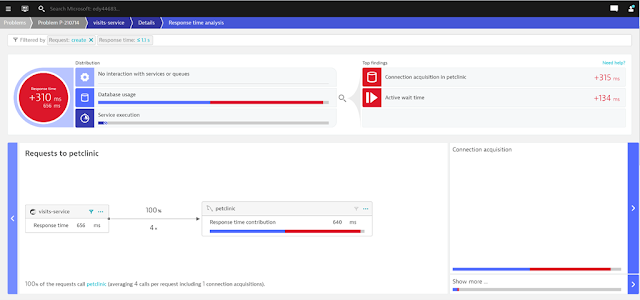
Dynatrace gives you insights on what caused these increases in response time, particularly the time taken to make a connection to a database service. In the example below, the Dynatrace portal calls out the time taken to make connections to a database.

Azure Exam Prep, Azure Certification, Azure Preparation, Azure Career, Azure Guides, Azure Learning, Azure Materials
Figure 10: Shows the time taken to make connections to a database

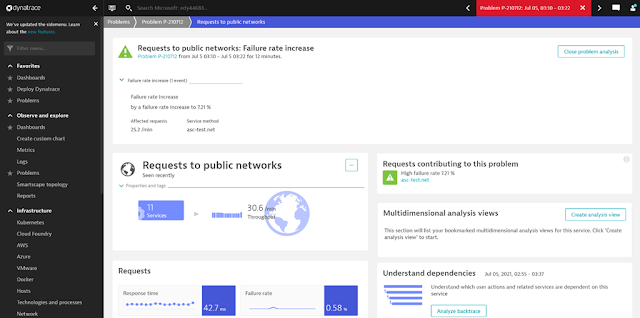
Dynatrace automatically detects all the failures. In the example below, Dynatrace signals an increase in failure rates to reach an external network.

Azure Exam Prep, Azure Certification, Azure Preparation, Azure Career, Azure Guides, Azure Learning, Azure Materials
Figure 11: Signals an increase in failure rates to reach an external network

Focus on delivering value to your end-users. Once instrumented, as you scale out to multiple Spring Boot application instances, any new application instances are automatically monitored for you. Dynatrace enables application developers to observe Spring Boot applications end-to-end. You spend less time managing the agent installation and maintenance and more energy on identifying and resolving incidents faster. Azure Spring Cloud service is on-point for periodically updating the Dynatrace OneAgent.

Build your solutions and monitor them today


Azure Spring Cloud is jointly built, operated, and supported by Microsoft and VMware. It is a fully managed service for Spring Boot applications that abstracts away the complexity of infrastructure and Spring Cloud middleware management, so you can focus on building your business logic and let Azure take care of dynamic scaling, patches, security, compliance, and high availability. With a few steps, you can provision Azure Spring Cloud, create applications, deploy, and scale Spring Boot applications and start monitoring in minutes. We will continue to bring more developer-friendly and enterprise-ready features to Azure Spring Cloud.
Source: microsoft.com