Showing posts with label Azure Monitor. Show all posts

Tuesday, 24 November 2020

Guest health feature in Azure Monitor for virtual machines

It is imperative to monitor the health of your virtual machine. But how much time do you spend reviewing each metric and alert to monitor the health of a virtual machine?

We are announcing the preview of Azure Monitor for virtual machines guest health feature that monitors the health of your virtual machines and fires an alert when any parameter being monitored is outside the acceptable range. This feature provides you:

◉ A simple experience to monitor the overall health of your virtual machine.

◉ Out-of-the-box health monitors based on key VM metrics to track the health of your virtual machine.

◉ Out-of-the-box alerts to notify if the virtual machine is unhealthy.

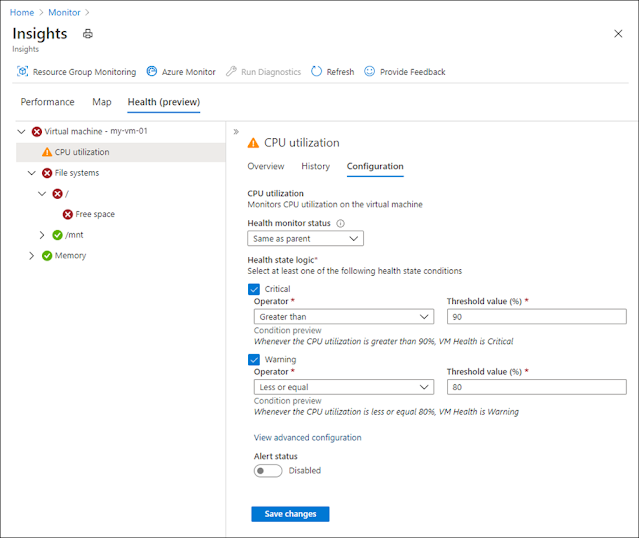
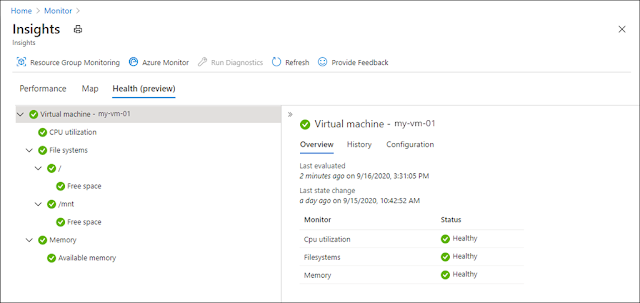
Virtual machine guest health feature has a parent-child hierarchical model. It monitors the health state of CPU, disks, and memory for a virtual machine and notifies the customer about the changes. The three states—healthy, warning, and critical—are defined based on the thresholds set by the customer for each child monitor. Each monitor measures the health of a particular component. The overall health of the virtual machine is determined by the health of its individual monitors. The top level monitor on the VM groups the health state of all the child monitors and provides a single health state of the virtual machine. It matches the state of the child monitor with the least healthy state.

Azure Study Material, Azure Certification, Azure Learning, Azure Exam Prep

Get started


You can view the health of each VM in your subscription and resource group in the Guest VM health column from the get started page of Azure Monitor for virtual machines.

Azure Study Material, Azure Certification, Azure Learning, Azure Exam Prep

Health tree


You can view the detailed health status of the VM by clicking on the health status from the get started page. In the side pane, the overview tab provides a description of the monitor, the last time it was evaluated, and values sampled to determine the current health state. The history tab lists the history of state changes for the monitor. You can view and modify the thresholds for critical and warning states for each monitor from the configuration tab. From this tab, you can also enable the alert status if you wish to receive an alert upon the state change of the monitor.

Azure Study Material, Azure Certification, Azure Learning, Azure Exam Prep

Pricing


There is no direct cost for the guest health feature, but there is a cost for ingestion and storage of health state data in the Log Analytics workspace. All data is stored in the HealthStateChangeEvent table.

Supported OS and regions


For the preview, only Azure Virtual Machines are supported. Virtual machine scale sets and Azure Arc for servers are not currently supported.

◉ Virtual machine must run one of the following operating systems:
     ◉ Ubuntu 16.04 LTS, Ubuntu 18.04 LTS
     ◉ Windows Server 2012 or later
◉ Virtual machine and Log Analytics workspace must be located in one of the regions as listed here.

Source: azure.microsoft.com

Sunday, 9 February 2020

Assess your servers with a CSV import into Azure Migrate

At Microsoft Ignite, we announced new Azure Migrate assessment capabilities that further simplify migration planning. In this post, we will demonstrate how to import servers into Azure Migrate Server Assessment through a CSV upload. Virtual servers of any hypervisor or cloud as well as physical servers can be assessed. You can get started with the CSV import feature by creating an Azure Migrate project or using your existing project.

Previously, Server Assessment required setting up an appliance in customer premises to perform discovery of VMware, Hyper-V virtual machines (VMs), and physical servers. We now also support importing and assessing servers without deploying an appliance. Import-based assessments provide support for Server Assessment features like Azure suitability analysis, migration cost planning, and performance-based rightsizing. The import-based assessment is helpful in the initial stages of migration planning, when you may not be able to deploy the appliance due to pending organizational or security constraints that prevent you from sending data to Azure.

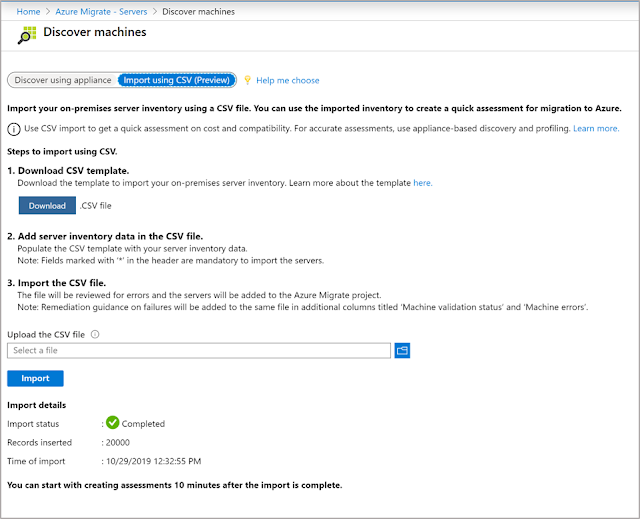
Importing your servers is easy. Simply upload the server inventory in a CSV file as per the template provided by Azure Migrate. Only four data points are mandatory — server name, number of cores, size of memory, and operating system name. While you can run the assessment with this minimal information, we recommend you provide disk data as well to avail disk sizing in assessments.

Azure Study Material, Azure Tutorial and Material, Azure Learning, Azure Guides, Azure Artificial Intelligence

Azure Study Material, Azure Tutorial and Material, Azure Learning, Azure Guides, Azure Artificial Intelligence

Azure Study Material, Azure Tutorial and Material, Azure Learning, Azure Guides, Azure Artificial Intelligence

Azure suitability analysis


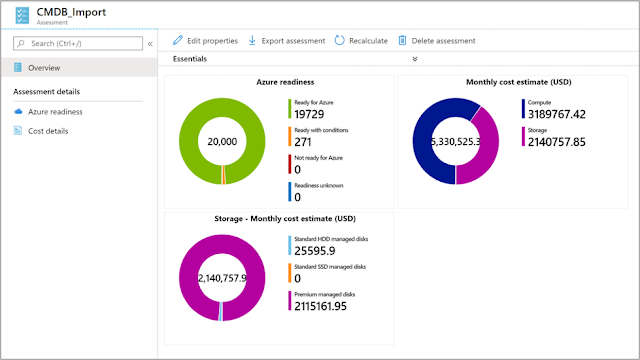
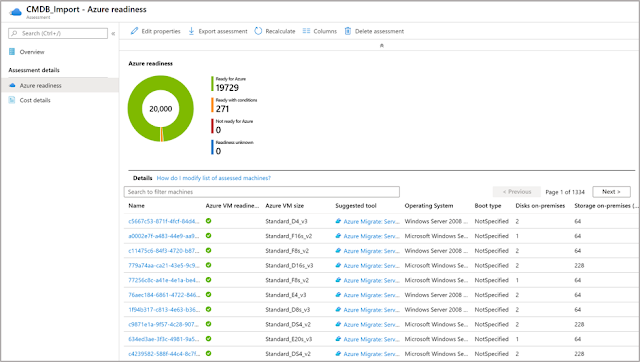
The assessment determines whether a given server can be migrated as-is to Azure. Azure support is checked for each server discovered; if it is found that a server is not ready to be migrated, remediation guidance is automatically provided. You can customize your assessment by changing its properties, and regenerate the assessment reports. You can also generate an assessment report by choosing a VM series of your choice and specify the uptime of the workloads you will run in Azure.

Cost estimation and sizing

Assessment reports provide detailed cost estimates. You can optimize on cost using performance-based rightsizing assessments; the performance utilization value you specify of your on-premises server is taken into consideration to recommend an appropriate Azure Virtual Machine and disk SKU. This helps to optimize and right-size on cost as you migrate servers that might be over-provisioned in your on-premises data center. You can apply subscription offers and Reserved Instance pricing on the cost estimates

Azure Study Material, Azure Tutorial and Material, Azure Learning, Azure Guides, Azure Artificial Intelligence

Assess your imported servers in four simple steps


1. Create an Azure Migrate project and add the Server Assessment solution to the project. If you already have a project, you do not need to create a new one. Download the CSV template for importing servers.

2. Gather the inventory data from a configuration management database (CMDB), or from your vCenter server, or Hyper-V environments. Convert the data into the format of the Azure Migrate CSV template.

3. Import the servers into Azure Migrate by uploading the server inventory in a CSV file as per the template.

5. Once you have successfully imported the servers, create assessments and review the assessment reports.

When you are ready to deploy an appliance, you can leverage the performance history gathered by the appliance for more accurate sizing, as well as plan migration phases using dependency analysis.

Get started right away by creating an Azure Migrate project. Note that the inventory metadata uploaded is persisted in the geography you select while creating the project. You can select a geography of your choice. Server Assessment is available today in Asia Pacific, Australia, Brazil, Canada, Europe, France, India, Japan, Korea, United Kingdom, and United States geographies.

Friday, 30 August 2019

Track the health of your disaster recovery with Log Analytics

Once you adopt Azure Site Recovery, monitoring of your setup can become a very involved exercise. You’ll need to ensure that the replication for all protected instances continue and that virtual machines are always ready for failover. While Azure Site Recovery solves this need by providing point-in-time health status, active health alerts, and the latest 72 hour trends, it still needs several man hours to keep track and analyze these signals. The problem is aggravated when the number of protected instances grow. It often needs a team of disaster recovery operators to do this for hundreds of virtual machines.

We have heard through multiple feedback forums that customers receive too many alerts. Even with these alerts, long-term corrective actions were difficult to identify as there is no single pane to look at historical data. Customers have reached out to us with a need to track various metrics such as recovery point objective (RPO) health over time, data change rate (churn) of machine disks over time, current state of the virtual machine, and test failover status as some of the basic requirements. It is also important for customers to be notified for alerts as per your enterprise’s business continuity and disaster recovery compliance needs.

The integrated solution with logs in Azure Monitor and Log Analytics


Azure Site Recovery brings to you an integrated solution for monitoring and advanced alerting powered by logs in Azure Monitor. You can now send the diagnostic logs from the Site Recovery vault to a workspace in Log Analytics. The logs are, also known as Azure Monitor logs, visible in the Create diagnostic setting blade as of today.

The logs are generated for Azure Virtual Machines, as well as any VMware or physical machines protected by Azure Site Recovery.

Azure Tutorials and Materials, Azure Learning, Azure Guides, Azure Online Exam, Azure Storage

Once the data starts feeding in the workspace, the logs can be queried using Kusto Query Language to produce historical trends, point-in-time snapshots, as well as disaster recovery admin level and executive level dashboards for a consolidated view. The data can be fed into a workspace from multiple Site Recovery vaults. Below are a few example use cases that can be currently solved with this integration:

◈ Snapshot of replication health of all protected instances in a pie chart

◈ Trend of RPO of a protected instance over time

◈ Trend of data change rate of all disks of a protected instance over time

◈ Snapshot of test failover status of all protected instances in a pie chart

◈ Summarized view as shown in the Replicated Items blade

◈ Alert if status of more than 50 protected instances turns critical

◈ Alert if RPO exceeds beyond 30 minutes for more than 50 protected instances

◈ Alert if the last disaster recovery drill was conducted more than 90 days ago

◈ Alert if a particular type of Site Recovery job fails

Sample use cases


Azure Tutorials and Materials, Azure Learning, Azure Guides, Azure Online Exam, Azure Storage

These are just some examples to begin with. Dig deeper into the capability with many more such examples captured in the documentation “Monitor Site Recovery with Azure Monitor Logs.” Dashboard solutions can also be built on this data to fully customize the way you monitor your disaster recovery setup. Below is a sample dashboard:

Azure Tutorials and Materials, Azure Learning, Azure Guides, Azure Online Exam, Azure Storage

Azure natively provides you the high availability and reliability for your mission-critical workloads, and you can choose to improve your protection and meet compliance requirements using the disaster recovery provided by Azure Site Recovery.

Tuesday, 9 July 2019

Scale action groups and suppress notifications for Azure alerts

In Azure Monitor, defining what to monitor while configuring alerts can be challenging. Customers need to be capable of defining when actions and notifications should trigger for their alerts, and more importantly, when they shouldn’t. The action rules feature for Azure Monitor, available in preview, allows you to define actions for your alerts at scale, and allows you to suppress alerts for scenarios such as maintenance windows.

Azure Certifications, Azure Tutorials and Materials, Azure Study Materials

Let’s take a closer look at how action rules (preview) can help you in your monitoring setup!

Defining actions at scale


Previously you could define what action groups trigger for your alerts while defining an alert rule. However, the actions that get triggered, whether it is an email that is sent or a ticket created in a ticketing tool, are usually associated with resource on which the alert is generated rather than the individual alert rule.

For example, for all alerts generated on the virtual machine contosoVM, I would typically want the following.

◈ The same email address to be notified (e.g. contosoITteam@contoso.com)

◈ Tickets to be created in the same ITSM tool

While you could define a single action group such as contosoAG and associate it with each and every alert rule authored on contosoVM, wouldn’t it be easier if you could easily associate contosoAG for every alert generated on contosoVM, without any additional configuration?

That’s precisely what action rules (preview) allow you to do. They allow you to define an action group to trigger for all alerts generated on the defined scope, this could be a subscription, resource group, or resource so that you no longer have to define them for individual alert rules!

Suppressing notifications for your alerts


There are often many scenarios where it would be useful to suppress the notifications generated by your alerts. This could be a planned maintenance window or even the suppression of notifications during non-business hours. You could possibly do this by disabling each and every alert rule individually, with complicated logic that accounts for time windows and recurrence patterns or you can get all of this out of the box by using action rules (preview).

Working on the same principle as before, action rules (preview) also allow you to define the suppression of actions and notifications for all alerts generated on a defined scope, which could be a subscription, resource group, or resource, while the underlying alert rules would continue to monitor. Furthermore, you have the capability to configure both the period as well as recurrence for the suppression, all out of the box! With this you could easily setup notification suppression based on your business requirements, which could be anything from suppression for all weekends such as a maintenance window, to suppression between 5pm – 9am everyday or normal business hours.

Filters for more flexibility


While you can easily define action rules (preview) to either author actions at scale or suppress them, action rules come with additional knobs and levers in the form of filters that allow you to fine tune what specific subset of your alerts the action rule acts on.

For example, going back to the example of suppressing notifications during non-business hours. Perhaps you might still want to receive notifications if there is an alert with severity zero or one, while the rest are suppressed. In such a scenario, I can define a severity filter as part of my action rule, which defines that the rule does not apply to alerts with severity of zero or one, and thus only applies to rules with severity of two, three or four.

Similarly, there are additional filters that provide even more granular definitions from the description of the alert to string matching within the alert’s payload

Azure Certifications, Azure Tutorials and Materials, Azure Study Materials

Sunday, 16 June 2019

Transforming Azure Monitor Logs for DevOps, granular access control, and improved Azure integration

Logs are critical for many scenarios in the modern digital world. They are used in tandem with metrics for observability, monitoring, troubleshooting, usage and service level analytics, auditing, security, and much more. Any plan to build an application or IT environment should include a plan for logs.

Logs architecture


There are two main paradigms for logs:

◈ Centralized: All logs are kept in a central repository. In this scenario, it is easy to search across resources and cross-correlate logs but, since these repositories get big and include logs from all kind of sources, it's hard to maintain access control on them. Some organizations completely avoid centralized logging for that reason, while other organizations that use centralized logging restrict access to very few admins, which prevents most of their users from getting value out of the logs.

◈ Siloed: Logs are either stored within a resource or stored centrally but segregated per resource. In these instances, the repository can be kept secure, and access control is coherent with the resource access, but it's hard or impossible to cross-correlate logs. Users who need a broad view of many resources cannot generate insights. In modern applications, problems and insights span across resources, making the siloed paradigm highly limited in its value.

To accommodate the conflicting needs of security and log correlations many organizations have implemented both paradigms in parallel, resulting in a complex, expensive, and hard-to-maintain environment with gaps in logs coverage. This leads to lower usage of log data in the organization and results in decision-making that is not based on data.

New access control options for Azure Monitor Logs


We have recently announced a new set of Azure Monitor Logs capabilities that allow customers to benefit from the advantages of both paradigms. Customers can now have their logs centralized while seamlessly integrated into Azure and its role based access control (RBAC) mechanisms. We call this resource-centric logging. It will be added to the existing Azure Monitor Logs experience automatically while maintaining the existing experiences and APIs. Delivering a new logs model is a journey, but you can start using this new experience today. We plan to enhance and complete alignment of all Azure Monitor's components over the next few months.

The basic idea behind resource-centric logs is that every log record emitted by an Azure resource is automatically associated with this resource. Logs are sent to a central workspace container that respects scoping and RBAC based on the resources. Users will have two options for accessing the data:

1. Workspace-centric: Query all data in a specific workspace–Azure Monitor Logs container. Workspace access permissions apply. This mode will be used by centralized teams that need access to logs regardless of the resource permissions. It can also be used for components that don't support resource-centric or off-Azure resources, though a new option for them will be available soon.

2. Resource-centric: Query all logs related to a resource. Resource access permissions apply. Logs will be served from all workspaces that contain data for that resource without the need to specify them. If workspace access control allows it, there is no need to grant the users access to the workspace. This mode works for a specific resource, all resources in a specific resource group, or all resources in a specific subscription. Most application teams and DevOps will be using this mode to consume their logs.

Azure Monitor experience automatically decides on the right mode depending on the scope the user chooses. If the user selects a workspace, queries will be sent in workspace-centric mode. If the user selects a resource, resource group, or subscription, resource-centric is used. The scope is always presented in the top left section of the Log Analytics screen:

Azure Monitoring, Azure DevOps, Azure Study Materials, Azure Guides, Azure Learning

You can also query all logs of resources in a specific resource group using the resource group screen:

Azure Monitoring, Azure DevOps, Azure Study Materials, Azure Guides, Azure Learning

Soon, Azure Monitor will also be able to scope queries for an entire subscription.

To make logs more prevalent and easier to use, they are now integrated into many Azure resource experiences. When log search is opened from a resource menu, the search is automatically scoped to that resource and resource-centric queries are used. This means that if users have access to a resource, they'll be able to access their logs. Workspace owners can block or enable such access using the workspace access control mode.

Another capability we're adding is the ability to set permissions per table that store the logs. By default, if users are granted access to workspaces or resources, they can read all their log types. The new table RBAC allows admins to use Azure custom roles to define limited access for users, so they're only able to access some of the tables, or admins can block users from accessing specific tables. You can use this, for example, if you want the networking team to be able to access only the networking related table in a workspace or a subscription.

As result of these changes, organizations will have simpler models with fewer workspaces and more secure access control. Workspaces now assume the role of a manageable container, allowing administrators to better govern their environments. Users are now empowered to view logs in their natural Azure context, helping them to leverage the power of logs in their day-to-day work.

The improved Azure Monitor Logs access control lets you now enjoy both worlds at once without compromise on usability and security. Central teams can have full access to all logs while DevOps teams can access logs only for their resources. This comes on top of the powerful log analytics, integration and scalability capabilities that are used by tens of thousands of customers.
Sunday, 31 March 2019

Announcing Azure Monitor AIOps Alerts with Dynamic Thresholds

We are happy to announce that Metric Alerts with Dynamic Thresholds is now available in public preview. Dynamic Thresholds are a significant enhancement to Azure Monitor Metric Alerts. With Dynamic Thresholds you no longer need to manually identify and set thresholds for alerts. The alert rule leverages advanced machine learning (ML) capabilities to learn metrics' historical behavior, while identifying patterns and anomalies that indicate possible service issues.

Metric Alerts with Dynamic Thresholds are supported through a simple Azure portal experience, as well as provides support for Azure workloads operations at scale by allowing users to configure alert rules through an Azure Resource Manager (ARM) API in a fully automated manner.

Why and when should I apply Dynamic Thresholds to my metrics alerts?


Smart metric pattern recognition – A big pain point with setting static threshold is that you need to identify patterns on your own and create an alert rule for each pattern. With Dynamic Thresholds, we use a unique ML technology to identify the patterns and come up with a single alert rule that has the right thresholds and accounts for seasonality patterns such as hourly, daily, or weekly. Let’s take the example of HTTP requests rate. As you can see below, there is definite seasonality here. Instead of setting two or more different alert rules for weekdays and weekends, you can now get Azure Monitor to analyze your data and come up with a single alert rule with Dynamic Thresholds that changes between weekdays and weekends.

Azure Monitor, Azure Certifications, Azure Guides, Azure Tutorial and Material, Azure Learning

Scalable alerting – Wouldn’t it be great if you could automatically apply an alert rule on CPU usage to any virtual machine (VM) or application that you create? With Dynamic Thresholds, you can create a single alert rule that can then be applicable automatically to any resource that you create. You don’t need to provide thresholds. The alert rule will identify the baseline for the resource and define the thresholds automatically for you. With Dynamic Thresholds, you now have a scalable approach that will save a significant amount of time on management and creation of alerts rules.

Domain knowledge – Setting a threshold often requires a lot of domain knowledge. Dynamic Thresholds eliminates that need with the use of your ML algorithms. Further, we have optimized the algorithms for common use cases such as CPU usage for a VM or requests duration for an application. So you can have full confidence that the alert will capture any anomalies while still reducing the noise for you.

Intuitive configuration – Dynamic Thresholds allow setting up metric alerts rules using high-level concepts, alleviating the need to have extensive domain knowledge about the metric. This is expressed by only requiring users to select the sensitivity for deviations (low, medium, high) and boundaries (lower, higher, or both thresholds) based on the business impact of the alert in the UI or ARM API.

Azure Monitor, Azure Certifications, Azure Guides, Azure Tutorial and Material, Azure Learning

Dynamic Thresholds also allow you to configure a minimum amount of deviations required within a certain time window for the system to raise an alert, the default time window is four deviations in 20 minutes. The user can configure this and choose what he/she would like to be alerted on by changing the failing periods and time window.

Azure Monitor, Azure Certifications, Azure Guides, Azure Tutorial and Material, Azure Learning

Azure Monitor, Azure Certifications, Azure Guides, Azure Tutorial and Material, Azure Learning

Metric Alerts with Dynamic Threshold is currently available for free during the public preview.

Friday, 22 February 2019

Modernize alerting using Azure Resource Manager storage accounts

Classic alerts in Azure Monitor will reach retirement this coming June. We recommend that you migrate your classic alert rules defined on your storage accounts, especially if you want to retain alerting functionality with the new alerting platform. If you have classic alert rules configured on classic storage accounts, you will need to upgrade your accounts to Azure Resource Manager (ARM) storage accounts before you migrate alert rules.

Identify classic alert rules


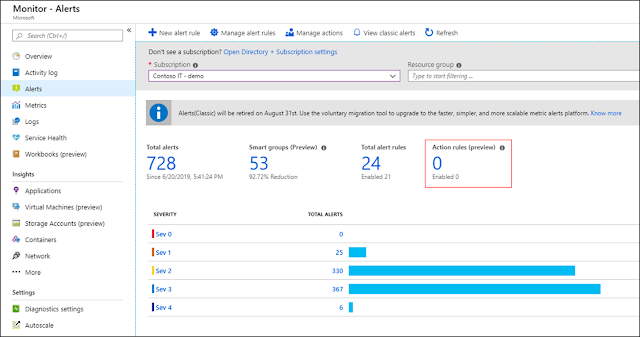
You should first find all classic alert rules before you migrate. The following screenshot shows how you can identify classic alert rules in the Azure portal. Please note, you can filter by subscription so you can find all classic alert rules without checking on each resource separately.

Azure Certification, Azure Guides, Azure Certification, Azure Learning

Migrate classic storage accounts to ARM


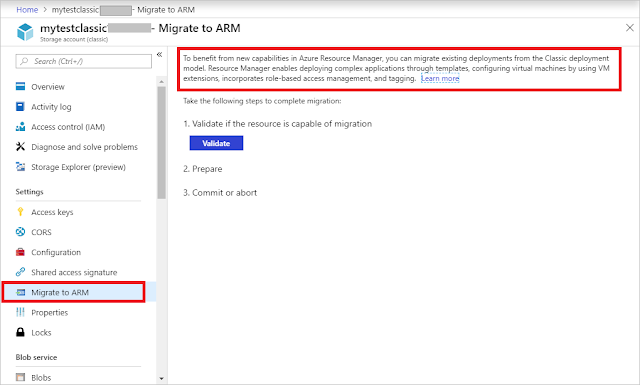
New alerts do not support classic storage accounts, only ARM storage accounts. If you configured classic alert rules on a classic storage account you will need to migrate to an ARM storage account.

You can use "Migrate to ARM" to migrate using the storage menu on your classic storage account. The screenshot below shows an example of this.

Azure Certification, Azure Guides, Azure Certification, Azure Learning

Re-create alert rules in new alerting platform


After you have migrated the storage account to ARM, you then need to re-create your alert rules. The new alerting platform supports alerting on ARM storage accounts using new storage metrics. In the storage blade, the menu is named "Alert" for the new alerting platform.

Before you re-create alert rules as a new alert for your storage accounts, you may want to understand the difference between classic metrics and new metrics and how they are mapped. 

The following screenshot shows how to create an alert based on “UsedCapacity.”

Azure Certification, Azure Guides, Azure Certification, Azure Learning

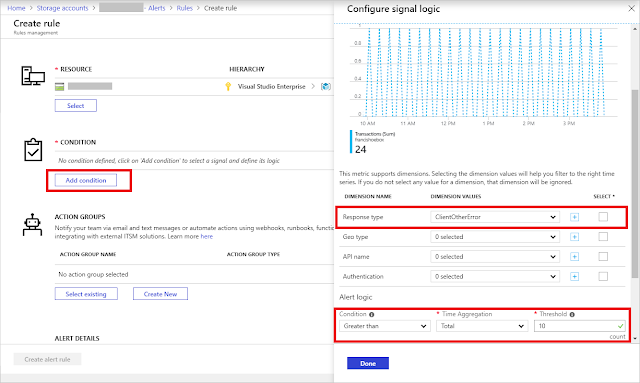
Some metrics include dimension, which allows you to see and use different dimension value types. For example, the transactions metric has a dimension named “ResponseType” and the values represent different type of errors and success. You can create an alert to monitor transactions on a particular error such as “ServerBusyError” or “ClientOtherError” with “ResponseType”.

The following screenshot shows how to create an alert based on Transactions with “ClientOtherError.”

Azure Certification, Azure Guides, Azure Certification, Azure Learning

In the list of dimension values, you won't see all supported values by default. You will only see values that have been triggered by actual requests. If you want to monitor conditions that have not happened, you can add a custom dimension value during alert creation. For example, when you have not had anonymous requests to your storage account yet, you can still setup alerts in advance to monitor such activity from upcoming requests.

The following screenshot shows how to add a custom dimension value to monitor upcoming anonymous transactions.

Azure Certification, Azure Guides, Azure Certification, Azure Learning

We recommend creating the new alert rules first, verify they work as intended, then remove the classic alerts.

Azure Monitor is a unified monitoring service that includes alerting and other monitor capabilities.

Monday, 18 February 2019

Monitor at scale in Azure Monitor with multi-resource metric alerts

Our customers rely on Azure to run large scale applications and services critical to their business. To run services at scale, you need to setup alerts to proactively detect, notify, and remediate issues before it affects your customers. However, configuring alerts can be hard when you have a complex, dynamic environment with lots of moving parts.

Today, we are excited to release multi-resource support for metric alerts in Azure Monitor to help you set up critical alerts at scale. Metric alerts in Azure Monitor work on a host of multi-dimensional platform and custom metrics, and notify you when the metric breaches a threshold that was either defined by you or detected automatically.

With this new feature, you will be able to set up a single metric alert rule that monitors:

◈ A list of virtual machines in one Azure region
◈ All virtual machines in one or more resource groups in one Azure region
◈ All virtual machines in a subscription in one Azure region

Benefits of using multi-resource metric alerts


◈ Get alerting coverage faster: With a small number of rules, you can monitor all the virtual machines in your subscription. Multi-resource rules set at subscription or resource group level can automatically monitor new virtual machines deployed to the same resource group/subscription (in the same Azure region). Once you have such a rule created, you can deploy hundreds of virtual machines all monitored from day one without any additional effort.

◈ Much smaller number of rules to manage: You no longer need to have a metric alert for every resource that you want to monitor.

◈ You still get resource level notifications: You still get granular notifications per impacted resource, so you always have the information you need to diagnose issues.

◈ Even simpler at scale experience: Using Dynamic Thresholds along with multi-resource metric alerts, you can monitor each virtual machine without the need to manually identify and set thresholds that fit all the selected resources. Dynamic condition type applies tailored thresholds based on advanced machine learning (ML) capabilities that learn metrics' historical behavior, as well as identifies patterns and anomalies.

Setting up a multi-resource metric alert rule


When you set up a new metric alert rule in the alert rule creation experience, use the checkboxes to select all the virtual machines you want the rule to be applied to. Please note that all the resources must be in the same Azure region.

Azure Study Materials, Azure Certifications, Azure Certifications, Azure Learning

You can select one or more resource groups, or select a whole subscription to apply the rule to all virtual machines in the subscription.

Azure Study Materials, Azure Certifications, Azure Certifications, Azure Learning

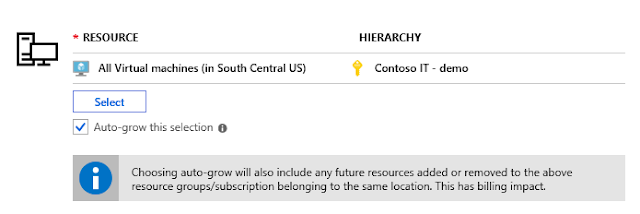
If you select all virtual machines in your subscription, or one or more resource groups, you get the option to auto-grow your selection. Selecting this option means the alert rule will automatically monitor any new virtual machines that are deployed to this subscription or resource group. With this option selected, you don’t need to create a new rule or edit an existing rule whenever a new virtual machine is deployed.

Azure Study Materials, Azure Certifications, Azure Certifications, Azure Learning

You can also use Azure Resource Manager templates to deploy multi-resource metric alerts.

Pricing


The pricing for metric alert rules is based on number of metric timeseries monitored by an alert rule. This same pricing applies to multi-resource metric alert rules.

Wrapping up


We are excited about this new capability that makes configuring and managing metric alerts rule at scale easier. This functionality is currently only supported for virtual machines with support for other resource types coming soon. We would love to hear what you think about it and what improvements we should make.