Showing posts with label Hadoop. Show all posts

Sunday, 9 September 2018

Powerful Debugging Tools for Spark for Azure HDInsight

Microsoft runs one of the largest big data cluster in the world – internally called “Cosmos”. This runs millions of jobs across hundreds of thousands of servers over multiple Exabytes of data. Being able to run and manage jobs of this scale by developers was a huge challenge. Jobs with hundreds of thousands of vertices are common and to even quickly figure out why a job runs slow or narrow down bottlenecks was a huge challenge. We built powerful tools that graphically show the entire job graph including the various vertex execution times, playback etc. which helped developers greatly. While this was built for our internal language in Cosmos (called Scope), we are working very hard to bring this power to all Spark developers.

Today, we are delighted to announce the Public Preview of the Apache Spark Debugging Toolset for HDInsight for Spark 2.3 cluster and forward.   The default Spark history server user experience is now enhanced in HDInsight with rich information on your spark jobs with powerful interactive visualization of Job Graphs & Data Flows. The new features greatly assist HDInsight Spark developers in job data management, data sampling, job monitoring and job diagnosis.

Spark History Server Enhancements


The Spark History Server Experience in HDInsight now features two new tabs: Graph and Data.

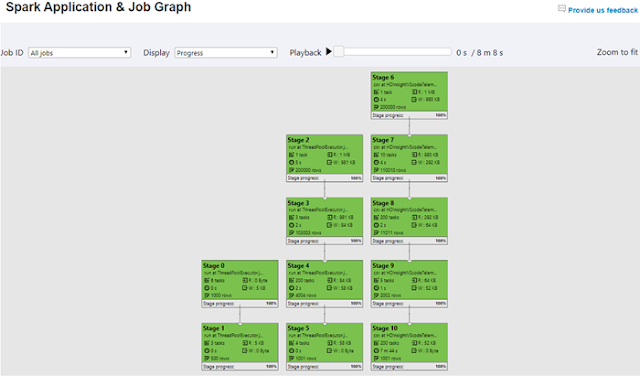
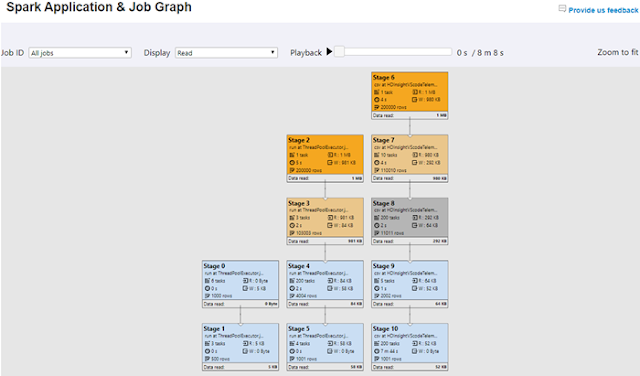
Graph Tab – Job graph is a powerful interactive visualization of your jobs. This interface enables innovative debugging experiences such as playback, heatmap by progress of job stages, read, written for Spark application and individual jobs.
Azure HDInsight, Azure Spark, Azure Guides, Azure Learning, Azure Certification, Azure Tutorial and Material

The Spark job graph displays Spark job executions details with data input and output across stages. For completed jobs, the Spark job graph allows Spark developer to playback the job by progress, data read and written with details. You can now dwell in Spark job diagnosis around performance, data and execution time using this experience which articulates various stage outliers.

Azure HDInsight, Azure Spark, Azure Guides, Azure Learning, Azure Certification, Azure Tutorial and Material

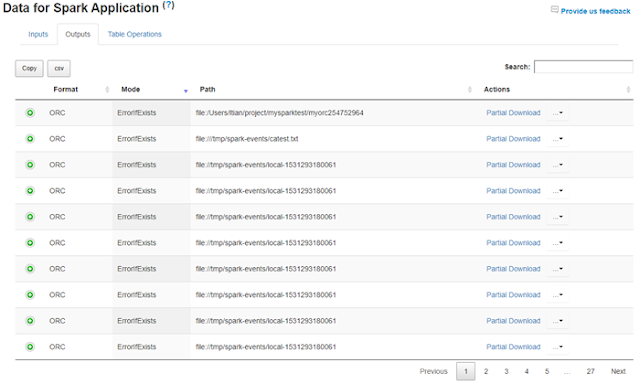
Data Tab – Job specific input, output data view, search, download, preview, data copy, data URL copy, data export to CSV, as well as table operations view are visualized in the data tab.

As a developers or data scientist, you can perform various actions such as preview, download, copy and export to CSV file of the data. You can also come here to partially download data as sample data for your local run and local debug. Metadata interpretation and correlation has always been a challenge in debugging. A cool feature has also been added around Table Operations, you are able to view the Hive metadata, investigate table operations at each stage to gain more insights for better troubleshooting and spark job analysis.

Azure HDInsight, Azure Spark, Azure Guides, Azure Learning, Azure Certification, Azure Tutorial and Material

Developer Nirvana


HDInsight Spark developers can greatly increase their productivity by leveraging these capabilities:

◈ Preview and download Spark job input and output data, as well as view Spark job table operations. 
◈ View and playback Spark application / job graph by progress, data read and written.
◈ Identify the Spark application execution dependencies among stages and jobs for performance tuning.
◈ View data read/write heatmap, identify the outliers and the bottlenecking stage and job for Spark job performance diagnosis.
◈ View Spark job/stage data input/output size and time duration for performance optimization.
◈ Locate failed stage and drill down for failed tasks details for debugging.

Getting Started with Apache Spark Debugging Toolset


These features have been built into HDInsight Spark history server.

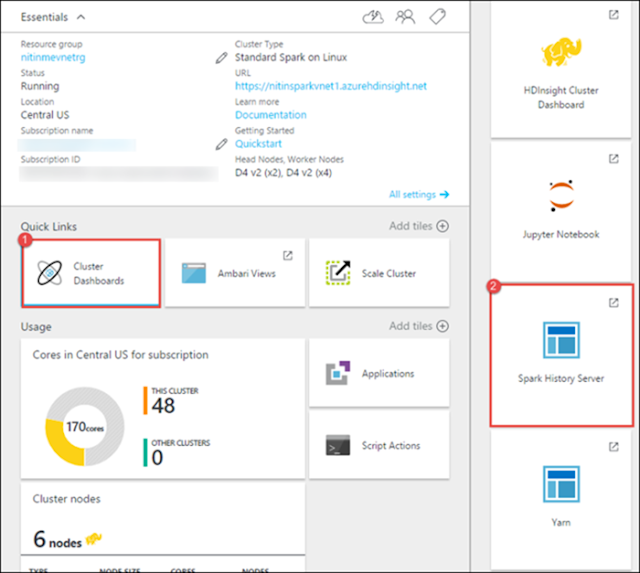
Access from the Azure portal - Open the Spark cluster, click Cluster Dashboard from Quick Links, and then click Spark History Server.

Azure HDInsight, Azure Spark, Azure Guides, Azure Learning, Azure Certification, Azure Tutorial and Material

More features to come


◈ Critical path analysis for Spark application and job
◈ Spark job diagnosis 
    ◈ Data Skew and Time Skew Analysis
    ◈ Executor Usage Analysis
◈ Debugging on failed job

Saturday, 18 August 2018

Azure HDInsight Interactive Query: simplifying big data analytics architecture

Traditional approach to fast interactive BI


Deep analytical queries processed on Hadoop systems have traditionally been slow. MapReduce jobs or hive queries are used for heavy processing of large datasets, however, not suitable for the fast response time required by interactive BI usage.

Faced with user dissatisfaction due to lack of query interactivity, data architects used techniques such as building OLAP cubes on top of Hadoop. An OLAP cube is a mechanism to store all the different dimensions, measures and hierarchies up front. Processing the cube usually takes place at the pre-specified interval. Post processing, results are available in advance, so once the BI tool queries the cube it just needs to locate the result, thereby limiting the query response time and making it a fast and interactive one. Since all measures get pre-aggregated by all levels and categories in the dimension, it is highly suitable for interactivity and fast response time. This approach is especially suitable if you need to light up summary views.

Azure HDInsight Interactive Query, Azure Guides, Azure Learning, Azure Certification, Azure Analytics

Above approach works for certain scenarios but not all. It tends to break down easily with large big data implementations, especially with use cases where many power users and data scientists are writing many ad-hoc queries.

Here are the key challenges:

◈ OLAP cubes require precomputations for creating aggregates which introduces latency. Businesses across all industries are demanding more from their reporting and analytics infrastructure within shorter business timeframes. OLAP cubes can’t deliver real-time analysis.

◈ In big data analytics, precomputation puts heavy burden on underlying Hadoop system creating unsustainable pressure on entire big data pipeline which severely hampers performance, reliability and stability of entire pipeline.

◈ This type of architecture forces large dataset movement between different systems which works well at small scale. However, falls apart at large data scale. Keeping data hot and fresh across multiple tiers is challenging.

◈ Power users and data scientists requires a lot more agility and freedom in terms of their ability to experiment using sophisticated ad-hoc queries that puts additional burden on overall system.

Azure HDInsight Interactive query overview


One of the most exciting new features of Hive 2 is Low Latency Analytics Processing (LLAP), which produces significantly faster queries on raw data stored in commodity storage systems such as Azure Blob store or Azure Data Lake Store.

This reduces the need to introduce additional layers to enable fast interactive queries.

Key benefits of introducing Interactive Query in your big data BI architecture:


Extremely fast Interactive Queries: Intelligent caching and optimizations in Interactive Query produces blazing-fast query results on remote cloud storage, such as Azure Blob and Azure Data Lake Store. Interactive Query enables data analysts to query data interactively in the same storage where data is prepared, eliminating the need for moving data from storage to another analytical engine for analytical needs.

HDInsight Interactive Query (LLAP) leverages set of persistent daemons that execute fragments of Hive queries. Query execution on LLAP is very similar to Hive without LLAP, except that worker tasks run inside LLAP daemons, and not in containers.

Azure HDInsight Interactive Query, Azure Guides, Azure Learning, Azure Certification, Azure Analytics

Lifecycle of a query: After client submits the JDBC query, query arrives at Hive Server 2 Interactive which is responsible for query planning, optimization, as well as security trimming. Since each query is submitted via Hive Server 2, it becomes the single place to enforce security policies.

Azure HDInsight Interactive Query, Azure Guides, Azure Learning, Azure Certification, Azure Analytics

File format versatility and Intelligent caching: Fast analytics on Hadoop have always come with one big catch: they require up-front conversion to a columnar format like ORCFile, Parquet or Avro, which is time-consuming, complex and limits your agility.

With Interactive Query Dynamic Text Cache, which converts CSV or JSON data into optimized in-memory format on-the-fly, caching is dynamic, so the queries determine what data is cached. After text data is cached, analytics run just as fast as if you had converted it to specific file formats.

Interactive Query SSD cache combines RAM and SSD into a giant pool of memory with all the other benefits the LLAP cache brings. With the SSD Cache, a typical server profile can cache 4x more data, letting you process larger datasets or supporting more users. Interactive query cache is aware of the underlying data changes in remote store (Azure Storage). If underlying data changes and user issues a query, updated data will be loaded in the memory without requiring any additional user steps.

Azure HDInsight Interactive Query, Azure Guides, Azure Learning, Azure Certification, Azure Analytics

Concurrency: With the introduction of much improved fine-grain resource management, preemption and sharing cached data across queries and users, Interactive Query [Hive on LLAP] makes it better for concurrent users.

In addition, HDInsight supports creating multiple clusters on shared Azure storage and Hive metastore helps in achieving a high degree of concurrency, so you can scale the concurrency by simply adding more cluster nodes or adding more clusters pointing to same underlying data and metadata.

Simplified and scalable architecture with HDInsight Interactive Query


By introducing Interactive Query to your architecture, you can now route power users, data scientists, and data engineers to hit Interactive Query directly. This architectural improvement will reduce the overall burden from the BI system as well as increases user satisfaction due to fast interactive query response as well as increases flexibility to run ad-hoc queries at will.

Azure HDInsight Interactive Query, Azure Guides, Azure Learning, Azure Certification, Azure Analytics

In above described architecture, users who wants to see the summary views can still be served with OLAP cubes. However, all other users leverage Interactive Query for submitting their queries.

Security model


Like Hadoop and Spark clusters, HDInsight Interactive Query leverages Azure Active Directory and Apache Ranger to provide fine-grain access control and auditing. 

In HDInsight Interactive Query, access restriction logic is pushed down into the Hive layer and Hive applies the access restrictions every time data access is attempted. This helps simplify authoring of the Hive queries and provides seamless behind-the-scenes enforcement without having to add this logic to the predicate of the query. 

User adoption with familiar tools


In big data analytics, organizations are increasingly concerned that their end users aren’t getting enough value out of the analytics systems because it is often too challenging and requires using unfamiliar and difficult-to-learn tools to run the analytics. HDInsight Interactive Query addresses this issue by requiring minimal to no new user training to get insight from the data. Users can write SQL queries (hql) in the tools they already use and love the most. HDInsight Interactive query out of the box supports BI tools such as Visual Studio Code, Power BI, Apache Zeppelin, Visual Studio, Ambari Hive View, Beeline, and Hive ODBC.

Azure HDInsight Interactive Query, Azure Guides, Azure Learning, Azure Certification, Azure Analytics

Built to complement Spark, Hive, Presto, and other big data engines


HDInsight Interactive query is designed to work well with popular big data engines such as Apache Spark, Hive, Presto, and more. This is especially useful because your users may choose any one of these tools to run their analytics. With HDInsight’s shared data and metadata architecture, users can create multiple clusters with the same or different engine pointing to same underlying data and metadata. This is very powerful concept as you are no longer bounded by one technology for analytics.

Azure HDInsight Interactive Query, Azure Guides, Azure Learning, Azure Certification, Azure Analytics

Try HDInsight now


We hope you will take full advantage fast query capabilities of HDInsight Interactive Query. We are excited to see what you will build with Azure HDInsight. Read this developer guide and follow the quick start guide to learn more about implementing these pipelines and architectures on Azure HDInsight.

About HDInsight


Azure HDInsight is Microsoft’s premium managed offering for running open source workloads on Azure. Azure HDInsight powers mission critical applications ranging in a wide variety of sectors including, manufacturing, retail education, nonprofit, government, healthcare, media, banking, telecommunication, insurance, and many more industries ranging in use cases from ETL to Data Warehousing, from Machine Learning to IoT, and more.

Thursday, 9 August 2018

Azure HDInsight Interactive Query: Ten tools to analyze big data faster

Customers use HDInsight Interactive Query (also called Hive LLAP, or Low Latency Analytical Processing) to query data stored in Azure storage & Azure Data Lake Storage in super-fast manner. Interactive query makes it easy for developers and data scientist to work with the big data using BI tools they love the most. HDInsight Interactive Query supports several tools to access big data in easy fashion. In this blog we have listed most popular tools used by our customers:

Microsoft Power BI


Microsoft Power BI Desktop has a native connector to perform direct query against  HDInsight Interactive Query cluster. You can explore and visualize the data in interactive manner.

Azure HDInsight, Azure Big Data, Azure Certification, Azure Study Materials

Apache Zeppelin


Apache Zeppelin interpreter concept allows any language/data-processing-backend to be plugged into Zeppelin. You can access Interactive Query from Apache Zeppelin using a JDBC interpreter.

Azure HDInsight, Azure Big Data, Azure Certification, Azure Study Materials

Visual Studio Code


With HDInsight Tools for VS Code, you can submit interactive queries as well at look at job information in HDInsight interactive query clusters.

Azure HDInsight, Azure Big Data, Azure Certification, Azure Study Materials

Visual Studio


Visual Studio integration helps you create and query tables in visual fashion. You can create a Hive tables on top of data stored in Azure Data Lake Storage or Azure Storage. 

Azure HDInsight, Azure Big Data, Azure Certification, Azure Study Materials

Ambari Hive View


Hive View is designed to help you author, optimize, and execute queries. With Hive Views you can:

◈ Browse databases.
◈ Write queries or browse query results in full-screen mode, which can be particularly helpful with complex queries or large query results.
◈ Manage query execution jobs and history.
◈ View existing databases, tables, and their statistics.
◈ Create/upload tables and export table DDL to source control.
◈ View visual explain plans to learn more about query plan.

Azure HDInsight, Azure Big Data, Azure Certification, Azure Study Materials

Beeline


Beeline is a Hive client that is included on the head nodes of HDInsight cluster. Beeline uses JDBC to connect to HiveServer2, a service hosted on HDInsight cluster. You can also use Beeline to access Hive on HDInsight remotely over the internet.

Azure HDInsight, Azure Big Data, Azure Certification, Azure Study Materials

Hive ODBC


Open Database Connectivity (ODBC) API, a standard for the Hive database management system, enables ODBC compliant applications to interact seamlessly with Hive through a standard interface.

Azure HDInsight, Azure Big Data, Azure Certification, Azure Study Materials

Tableau


Tableau is very popular data visualization tool. Customers can build visualizations by connecting Tableau with HDInsight interactive Query.

Azure HDInsight, Azure Big Data, Azure Certification, Azure Study Materials

Azure HDInsight, Azure Big Data, Azure Certification, Azure Study Materials

Apache DBeaver


Apache DBeaver is SQL client and a database administration tool. It is free and open-source (ASL). DBeaver use JDBC API to connect with SQL based databases.

Azure HDInsight, Azure Big Data, Azure Certification, Azure Study Materials

Excel


Microsoft Excel is the most popular data analysis tool and connecting it with big data is even more interesting for our customers. Azure HDInsight Interactive Query cluster can be integrated with Excel with ODBC connectivity.

Azure HDInsight, Azure Big Data, Azure Certification, Azure Study Materials

Wednesday, 27 December 2017

Azure HDInsight Performance Benchmarking: Interactive Query, Spark and Presto

Fast SQL query processing at scale is often a key consideration for our customers. In this blog post we compare HDInsight Interactive Query, Spark, and Presto using the industry standard TPCDS benchmarks. These benchmarks are run using out of the box default HDInsight configurations, with no special optimizations.

Summary of the results


◉ HDInsight Interactive Query is faster than Spark.
◉ HDInsight Spark is faster than Presto.
◉ Text caching in Interactive Query, without converting data to ORC or Parquet, is equivalent to warm Spark performance.
◉ Interactive query is most suitable to run on large scale data as this was the only engine which could run all TPCDS 99 queries without any modifications at 100TB scale.
◉ Interactive Query preforms well with high concurrency.

About TPCDS


The TPC Benchmark DS (TPC-DS) is a decision support benchmark that models several generally applicable aspects of a decision support system, including queries and data maintenance. According to TPCDS, the benchmark provides a representative evaluation of performance as a general purpose decision support system. A benchmark result measures query response time in single user mode, query throughput in multi-user mode and data maintenance performance for a given hardware, operating system, and data processing system configuration under a controlled, complex, and multi-user decision support workload. The purpose of TPC benchmarks is to provide relevant, objective performance data to industry users. TPC-DS Version 2 enables emerging technologies, such as big data systems, to execute the benchmark. Please note that these are unaudited results.

HDInsight Interactive Query


HDInsight Interactive Query enables you to get super fast query results from your big data with ZERO ETL (Extract Transform & Load).

Interactive Query in HDInsight leverages (Hive on LLAP) intelligent caching, optimizations in core engines, as well as Azure optimizations to produce blazing-fast query results on remote cloud storage, such as Azure Blob and Azure Data Lake Store.

Comparative performance of Spark, Presto, and LLAP on HDInsight


We conducted these test using LLAP, Spark, and Presto against TPCDS data running in a higher scale Azure Blob storage account*. These storage accounts now provide an increase upwards of 10x to Blob storage account scalability. Over last few months we have also contributed to improve the performance of Windows Azure Storage Driver (WASB), which as a result has helped improve the performance for all HDInsight workloads.

To get your standard storage accounts to grow past the advertised limits in capacity, ingress/egress and request rate.

We picked a common external Hive metastore, Azure SQL DB S2, so that various engines could go against the same data and metadata.

HDInsight configuration


For these tests, we used a similar cluster to run LLAP, Spark, and Presto.

Note: Tests were performed using the default out-of-the-box configurations resulting in no optimizations, no special settings, and no query change for any engine. 

The table below uses 45 queries that ran on all engines successfully. As shown, LLAP was able to run many more queries than Presto or Spark.


As you can see with above run, LLAP with ORC is faster than all other engines. What’s an even more interesting observation is that LLAP with Text is also very fast. Even faster then Spark with Parquet file format.   

Fast analytics on Hadoop have always come with one big catch, they require up-front conversion to a columnar format like ORC or parquet, which can be time consuming and expensive with on-demand computing. LLAP Dynamic Text Cache converts CSV or JSON data into LLAP’s optimized in-memory format on-the-fly. Caching is dynamic so the queries your users run determine what data is cached.

HDInsight Interactive Query(LLAP) architecture

LLAP also utilized cluster memory DRAM and SSD to provide better performance. Cache pool is a joint pool made up of cluster DRAM and SSD. To give you an example, with D14V2 VM’s in Azure you an get 112 GB of RAM and 800 GB of local SSD, so just a couple of nodes are good enough to keep over a terabyte of data in memory for fast query performance.

Text caching in Interactive Query


Text caching in Interactive Query is a very interesting concept which has caused us to think about big data pipelines very differently. Traditionally, after ingesting data in raw form we needed to convert the data to an optimized file format such as ORC, Parquet, or Avro, as these file formats ensured users would receive good performance while querying the big data. With text caching, raw text and json performance is very similar to ORC which eliminates the need for having additional steps in our big data pipeline, resulting in cost saving as well as faster and fresher query results.


Running Interactive Query on 100TB TPCDS data


As we see many benchmarks all over the web by different vendors, one thing we notice was that they focus on only a select set of queries where their respective engine will produce the best results. We decided to run all 99 queries at 100 TB scale, and only Interactive Query was able to run these unmodified. 41% of queries were returned under 30 seconds, and 71% of queries came back under 2 minutes. This benchmarks proves that Interactive query is fast, has rich SQL, and scales at much larger scale levels without any special efforts.  


Concurrency


With the introduction of much improved fine-grain resource management and preemption, Interactive Query (Hive on LLAP) makes it easier for concurrent users. With Interactive Query, the only limit to concurrency is cluster resources. Cluster can be scaled to achieve higher and higher levels of concurrency.

We used number of different concurrency levels to test the concurrency performance. For the dataset, we again used 99 TPCDS queries on 1 TB data with 32 worker node cluster with max concurrency set to 32.

Test 1: Run all 99 queries, 1 at a time - Concurrency = 1

Test 2: Run all 99 queries, 2 at a time - Concurrency = 2

Test 3: Run all 99 queries, 4 at a time - Concurrency = 4

Test 4: Run all 99 queries, 8 at a time - Concurrency = 8

Test 5: Run all 99 queries, 16 at a time - Concurrency = 16

Test 6: Run all 99 queries, 32 at a time - Concurrency = 32

Test 7: Run all 99 queries, 64 at a time - Concurrency = 64

Results: As outlined in the above results, Interactive Query is a super optimized engine for running concurrent queries. The longest time to finish the workload was with single concurrent query.   


Comparison with Hive and performance improvements over time


Its important that we compare Interactive Query (LLAP) performance with Hive. There has been a ton of work done to make Hive more performant in the community, as well as some of the work we have been doing to improve Windows Azure storage driver performance. Back in January 2017, it took 200 minutes to run the TPCDS workload with Hive 1.2, and with the storage driver improvements Hive can now run the benchmark in 137 minutes. With LLAP cached data, the benchmark completes in 49 minutes. These are impressive gains.


Integration with Power BI direct Query, Apache Zeppelin, and other tools


Power BI now allows you to connect directly to your HDInsight Interactive Query cluster to explore and monitor data without requiring a data model as an intermediate cache. This offers interactive exploration of your data and automatically refreshes the visuals without requiring a scheduled refresh. 


HDInsight Interactive Query supports many end points. You can also use Apache Zeppelin , Visual Studio, Visual Studio Code, Hive View, and Beeline to run your queries

Wednesday, 20 December 2017

Azure HDInsight Integration with Azure Log Analytics is now generally available

I am excited to announce the general availability of HDInsight Integration with Azure Log Analytics.

Azure HDInsight is a fully managed cloud service for customers to do analytics at scale using the most popular open-source engines such as Hadoop, Hive/LLAP, Presto, Spark, Kafka, Storm, HBase etc.

Thousands of our customers run their big data analytical applications on HDInsight at global scale. The ability to monitor this infrastructure, detect failures quickly and take quick remedial action is key to ensuring a better customer experience.

Log Analytics is part of Microsoft Azure's overall monitoring solution. Log Analytics helps you monitors cloud and on-premises environments to maintain availability and performance.

Our integration with log analytics will make it easier for our customers to operate their big data production workloads more effective and simple manner.

Monitor & debug full spectrum of big data open source engines at global scale


Typical big data pipelines utilize multiple open source engines such as Kafka for Ingestion, Spark streaming or Storm for stream processing, Hive & Spark for ETL, Interactive Query [LLAP] for blazing fast querying of big data.

Additionally, these pipelines may be running in different datacenters across the globe.

With new HDInsight monitoring capabilities, our customers can connect different HDInsight clusters to Log Analytics workspace and monitor them with single pane of glass.

Image: Monitoring your global big data deployments with single pane of glass

Collect logs and metrics from open source analytics engines


Once Azure Log Analytics is enabled on your cluster, you will see important logs and metrics from number of different open source frameworks as well as cluster VM level metrics such as CPU usage, memory utilization and more. Customers will be able to get a full view into their cluster, from one location.

Many of our customers take advantage of elasticity of the cloud by creating and deleting clusters to minimize their costs. However, they want to retain the job logs and other useful information even after the cluster is terminated. With Azure log analytics, customers can retain the job information even after the cluster is deleted.

Below are some of the key metrics and logs collected from your HDInsight clusters.

Yarn Resource Manager, Yarn Applications, Hive, Mapreduce, Kafka, Storm, Hive Server 2, Hive Server Interactive, Oozie, Spark, Spark executor and driver Livy, Storm, HBase, Phoenix, Juypter, LLAP, Zookeeper, and many more.

Image: Logs & Metrics from various Open Source engines.

Visualize key metrics with solution templates


To make it easier we have created number of visualizations so that our customers can understand important metrics. We have published multiple solution templates for you to get started quickly. You can install these solutions templates from Azure portal directly, under Monitoring + Management.

Image: Installing HDInsight solution templates from Azure portal

Once installed, you can see visualize the key metrics. In the example below you can see the dashboard for your Spark clusters.

Image: Spark dashboard

Troubleshoot issues faster


It’s important to be able to detect and troubleshoot issues faster and find the root cause when developing big data applications in Hive, Spark or Kafka.

With log analytics portal, you can:

◉ Write queries to quickly find issues of important data in your logs and metrics
◉ Filter, sort, and group results within a time range
◉ See your data in tabular format or in a chart

Below is the example query to look at application metrics from a Hive query

search *

| where Type contains "application_stats_dag_CL" and ClusterName_s contains "testhive02"

|order by TimeGenerated desc

Image: troubleshooting hive jobs 

Enabling Log Analytics


Log Analytics integration with HDInsight is enabled via the Azure portal, PowerShell or the Azure SDK. 

Enable-AzureRmHDInsightOperationsManagementSuite
        [-Name] <String>
        [-WorkspaceId] <String>
        [-PrimaryKey] <String>
        [-ResourceGroupName <String>]
        [-DefaultProfile <IAzureContextContainer>]
        [-WhatIf]
        [-Confirm]
        [<CommonParameters>]

Image: Enabling log Analytics from Azure portal