We are pleased to let you know that you can leverage the same workflow to build your own Microsoft Operations Management Suite (OMS) monitoring solution for Azure Backup in the upgraded OMS workspace. The OMS monitoring solution allows you to monitor key backup parameters such as backup and restore jobs, backup alerts, and cloud storage usage across Recovery Services vaults and subscriptions. You can then utilize OMS log analytics capabilities to raise further alerts for events that you deem important for the business to be notified of. You could even open tickets through webhooks or ITSM integration using the OMS log analytics capabilities.
Here’s how you do it…
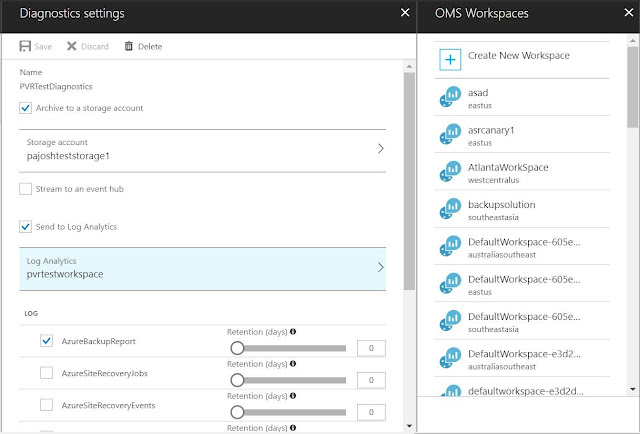
You can open the diagnostic setting window from the Azure Recovery services vault, or you can open the diagnostic setting window by logging into Azure portal. First, click “Monitor” service followed by “Diagnostic settings” in settings section. You can then specify the relevant Subscription, Resource Group, and Recovery Services Vault. In the Diagnostic settings window, as shown below, you can select “Send data to log analytics” and then select the relevant OMS workspace. You can choose any existing log analytics workspace, such that all vaults pump the data to the same workspace
Please select the relevant log, “AzureBackupReport” in this case, to be sent to the log analytics workspace. Click “Save” to save the setting.
Here’s how you do it…
Configuring Diagnostic settings
You can open the diagnostic setting window from the Azure Recovery services vault, or you can open the diagnostic setting window by logging into Azure portal. First, click “Monitor” service followed by “Diagnostic settings” in settings section. You can then specify the relevant Subscription, Resource Group, and Recovery Services Vault. In the Diagnostic settings window, as shown below, you can select “Send data to log analytics” and then select the relevant OMS workspace. You can choose any existing log analytics workspace, such that all vaults pump the data to the same workspace
Please select the relevant log, “AzureBackupReport” in this case, to be sent to the log analytics workspace. Click “Save” to save the setting.
After you have completed the configuration, you should wait for 24 hours for initial data push to complete.
Deploying solution to Azure OMS
The OMS monitoring solution template for Azure Backup is a community driven project where you can deploy the base template to Azure and then customize it to fit your needs.
Monitoring Azure Backup data
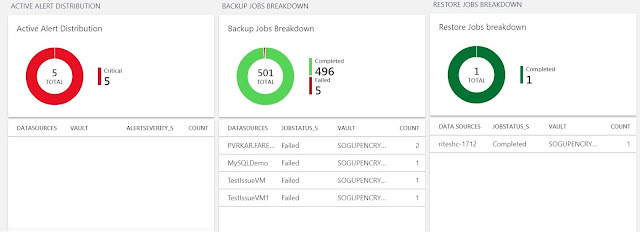
The overview tile in the dashboard reflects the key parameter, which is the backup jobs and their status.
Clicking on the overview tile will take you to the dashboard where the solution has information categorized into jobs and alerts status, and active machines and their storage usage.
MAKE SURE YOU SELECT THE RIGHT DATE RANGE AT THE TOP OF THE SCREEN to filter the data for the required time interval.
Log search capabilities
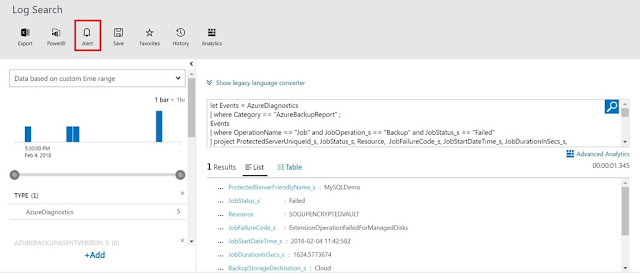
You can click on each tile to get more details about the queries used to create the tile and configure it to meet your requirement. Clicking further on values appearing in the tiles will lead you to the Log Analytics screen where you can raise alerts for configurable event thresholds and automate actions to be performed when those thresholds are met/crossed.


0 comments:
Post a Comment