Thursday 31 May 2018

Gain application insights for Big Data solutions using Unravel data on Azure HDInsight

Unravel on HDInsight enables developers and IT Admins to manage performance, auto scaling & cost optimization better than ever.

We are pleased to announce Unravel on Azure HDInsight Application Platform. Azure HDInsight is a fully-managed open-source big data analytics service for enterprises. You can use popular open-source frameworks (Hadoop, Spark, LLAP, Kafka, HBase, etc.) to cover broad range of scenarios such as ETL, Data Warehousing, Machine Learning, IoT and more. Unravel provides comprehensive application performance management (APM) for these scenarios and more. The application helps customers analyze, optimize, and troubleshoot application performance issues and meet SLAs in a seamless, easy to use, and frictionless manner. Some customers report up to 200 percent more jobs at 50 percent lower cost using Unravel’s tuning capability on HDInsight.

How complex is guaranteeing an SLA on a Big Data solution?


The inherent complexity of big data systems, disparate set of tools for monitoring, and lack of expertise in optimizing these open source frameworks create significant challenges for end-users who are responsible for guaranteeing SLAs. Users today have to monitor their applications with Ambari which only provides infrastructure metrics to administer the cluster health, performance and utilization. Big Data solutions use a variety of open source frameworks. Monitoring applications running across all of these frameworks is a daunting task. Users have to troubleshoot issues manually by analyzing logs from YARN, Hive, Tez, LLAP, Pig, Spark, Kafka, etc. To get good performance, users may have to change settings in Spark executors, YARN queues, Kafka topic configuration, region servers in HBase, storage throttling, sizing of compute and more. Unravelling this complexity is an art and science.

Monitoring Big Data applications now made easy with Unravel


Unravel on HDInsight provides intelligent applications and operations management for Big Data a breeze. Its Application Performance Management correlates full-stack performance and provides automated insights and recommendations. Users can now analyze troubleshoot and optimize performance with ease. Here are the key value propositions of Unravel on HDInsight:

Proactive alerting and automatic actions


◈ Proactive alerts on applications missing SLAs, violating usage policies or affecting other applications running on the cluster.

◈ Automatic actions to resolve above issues using dynamic thresholds and company defined policies such as killing bad applications, re-directing apps based on priority levels.

Analyze app performance


◈ Intuitive, end-to-end view of application performance with drill-down capabilities into bottlenecks, problem areas and errors.

◈ Correlated insights into all factors affecting app performance such as resource allocation, container utilization, poor configuration settings, task execution pattern, data layout, resource contention and more.

◈ Rapid detection of performance and cost issues caused by applications.

Following is an example of how Unravel diagnosed poor resource usage and high cost caused by a Hive on Tez application. Tuning the application using recommendations provided by Unravel reduced the cost of running this application by 10 times.

Azure Tutorials and Materials, Azure Guides, Azure Learning, Azure Certifications

Here is an example of cluster utilization after using Unravel. Unravel enables you to utilize resources efficiently and auto scale the cluster based on SLA needs, which results in cost savings.

Azure Tutorials and Materials, Azure Guides, Azure Learning, Azure Certifications

AI-driven intelligent recommendation engine


◈ Recommend optimal values for fastest execution and/or least resource utilization including: data parallelism, optimal container size, number of tasks, etc.

The example below shows how Unravel’s AI-driven engine provides actionable recommendations for optimal performance of a Hive query.

Azure Tutorials and Materials, Azure Guides, Azure Learning, Azure Certifications

◈ Identify and automatically fix issues related to poor execution, skew, expensive joins, too many mappers/reducers, caching, etc.

Following is an example of Unravel automatically detecting lag in a real-time IoT application using Spark Streaming & Kafka and recommending a solution.

Azure Tutorials and Materials, Azure Guides, Azure Learning, Azure Certifications

Get started with Unravel on HDInsight


Customers can easily install Unravel on HDInsight using a single click in Azure portal. Unravel provides a live view into the behavior of big data applications using open source frameworks such as Hadoop, Hive, Spark, Kafka, LLAP and more on Azure HDInsight.

Azure Tutorials and Materials, Azure Guides, Azure Learning, Azure Certifications

After installing you can launch the Unravel application from the Applications blade of the cluster as shown below.

Azure Tutorials and Materials, Azure Guides, Azure Learning, Azure Certifications

Tuesday 29 May 2018

Visibility into network activity with Traffic Analytics - now in public preview

We are announcing the public preview of Traffic Analytics, a cloud-based solution that provides visibility into user and application traffic on your cloud networks.

Traffic Analytics analyzes NSG Flow Logs across Azure regions and equips you with actionable information to optimize workload performance, secure applications and data, audit your organization’s network activity and stay compliant.

With Traffic Analytics, you now can:
  • Gain visibility into network activity across your cloud networks. Solution provides insights on:
    • traffic flows across your networks between Azure and Internet, in Azure,  public cloud regions, VNETs and subnets.
    • inter-relationships between critical business services and applications.
    • applications and protocols on your network, without the need for sniffers or dedicated flow collector appliances.
  • Secure your network; Identify threats on your network, such as:
    • flows between your VMs and rogue networks.
    • network ports open to the Internet.
    • applications attempting Internet access.
    • anomalous network traffic behavior (e.g. back-end servers attempting connectivity, to servers outside your network etc.)
  • Improve performance of your applications by:
    • capacity planning - eliminate issues of over-provisioning or under utilization by monitoring utilization trends of VPN gateways and other services.
    • analyzing in-bound and out-bound flows.
    • understanding application access patterns (e.g. Where are the users located?, Can application latency be reduced by better workload placement?).
    • identification of traffic hotspots.
With this release, Traffic Analytics brings rich flow monitoring capabilities to your Azure cloud that are on-par with capabilities available on campus networks (via NetFlow, IPFIX, sFlow based tools), without the need for packet capture or flow collection appliances.

Get Started


Find out what’s happening on your cloud!

Microsoft Azure, Azure Certifications, Azure Learning, Microsoft Tutorial and Materials

Figure 1: NOC View provides an overview of flows across various regions in Azure.

Microsoft Azure, Azure Certifications, Azure Learning, Microsoft Tutorial and Materials

Figure 2: Geo-map showing traffic across Azure regions.  Red dots indicate sources of malicious traffic.

Microsoft Azure, Azure Certifications, Azure Learning, Microsoft Tutorial and Materials

Figure 3: VNET conversation map, with a summary of communicating countries, data centers, hosts etc.

Saturday 26 May 2018

Transact capabilities for SaaS apps now available in Azure Marketplace

Increasingly, customers are turning to cloud marketplaces to discover, trial, and buy cloud solutions. Software as a service (SaaS) apps are a core part of those customer needs. Azure Marketplace has long-offered SaaS apps for discovery and trial. At Build, we announced that SaaS apps can now be transacted within Azure Marketplace.

What does this mean for partners?


ISVs building and selling SaaS applications built for Azure can now not only list or offer trials, but also monetize their SaaS applications directly with customers. This allows partners:

To expose offers easily

◈ Simple listing with a Contact Me option
◈ Easy integration of a trial experience from Azure Marketplace
◈ Monetize with a subscription API service

More procurement options

◈ Offer simple, flat monthly pre-paid billing
◈ Streamline billing for customers through consolidated Azure billing and invoicing
◈ Spend less time wrestling with enterprise procurement

To get access to a global customer base and a global salesforce

◈ Gather leads immediately to a CRM
◈ Let marketplace facilitate co-selling with Microsoft sellers and help customers: find, try and buy partner SaaS applications

What does this mean for customers?


For IT Pros and Developers looking for any SaaS offer or subscription, Azure Marketplace allows those users to discover, try and now subscribe to SaaS solutions. This means customers can:

Find, try, and buy SaaS applications

◈ Find dozens of SaaS solutions to meet more business needs and enhance their Cloud Solutions
◈ Try solutions with integrated login experience (AAD trial enabled) with access to free trials and downloads
◈ Subscribe to SaaS applications with subscription offers

Reduce the friction of procurement and payment

◈ Flat monthly pre-paid billing ($/mo)
◈ Reduce procurement overhead with billing all delivered through Microsoft
◈ Manage subscriptions in one place

Easily manage subscriptions

◈ Manage all app subscriptions within Azure Management
◈ Easy cancel at any time

Get started with SaaS subscriptions


You can discover SaaS services in both Azure marketplace as well as Azure portal. You can subscribe to a SaaS service in Azure portal.

At the time of launch, the supported billing model is a flat monthly fee per subscription of the SaaS service. We are working on enabling additional business models in the future.

Azure Tutorials and Materials, Azure Guides, Azure Learning, Azure Certifications

You can use the new ‘Software as a service (SaaS)’ experience to discover and manage all your SaaS services.

Azure Tutorials and Materials, Azure Guides, Azure Learning, Azure Certifications

Once a SaaS service has been subscribed to, it can be in one of the following states:

◈ Pending – You have subscribed to the SaaS service in Azure. However, you have not started using the SaaS service yet. At this point, your monthly recurring payment has not started yet.
◈ Subscribed – You have subscribed to the SaaS service in Azure and started consuming the SaaS service. You will be charged the flat monthly fee every month, unless you delete your account in the SaaS service or delete your SaaS service in Azure portal.
◈ Unsubscribed – You have unsubscribed or deleted the account directly in the SaaS service. You will not be billed once you have unsubscribed from the SaaS service.

Integration with Azure marketplace to enable SaaS transactions is achieved through the following simple steps:

◈ Notify Azure whenever a user, who came to the SaaS service from Azure, signs up for a new account.
◈ Notify Azure whenever a registered user from Azure changes the plan (example: user moves from ‘basic’ plan to a ‘premium’ plan).
◈ Notify Azure whenever a registered user unsubscribes or deletes the account.
◈ Receive and act on notifications from Azure, if the user has unsubscribed from the SaaS service in Azure.

Thursday 24 May 2018

Control Azure Data Lake costs using Log Analytics to create service alerts

Azure Data Lake customers use the Data Lake Store and Data Lake Analytics to store and run complex analytics on massive amounts of data. However it is challenging to manage costs, keep up-to-date with activity in the accounts, and proactively know when usage thresholds are nearing certain limits. Using Log Analytics and Azure Data Lake we can address these challenges and know when the costs are increasing or when certain activities take place.

Azure Tutorials and Materials, Azure Learning, Azure Certifications, Azure Analytics

In this post, you will learn how to use Log Analytics with your Data Lake accounts to create alerts that can notify you of Data Lake activity events and when certain usage thresholds are reached. It is easy to get started!

Step 1: Connect Azure Data Lake and Log Analytics


Data Lake accounts can be configured to generate diagnostics logs, some of which are automatically generated (e.g. regular Data Lake operations such as reporting current usage, or whenever a job completes). Others are generated based on requests (e.g. when a new file is created, opened, or when a job is submitted). Both Data Lake Analytics and Data Lake Store can be configured to send these diagnostics logs to a Log Analytics account where we can query the logs and create alerts based on the query results.

Step 2: Create a query that can identify a specific event or aggregated threshold


Specific key questions about the state or usage of your Azure Data Lake account can be generally answered with a query that parses usage or metric logs. To query the logs in Log Analytics, in the account home (OMS Workspace), click on Log Search.

Azure Tutorials and Materials, Azure Learning, Azure Certifications, Azure Analytics

In the Log Search blade, you can start typing queries using Log Analytics Query Language:

Azure Tutorials and Materials, Azure Learning, Azure Certifications, Azure Analytics

There are two main types of queries that can be used in Log Analytics to configure alerts:

◈ Queries that return individual events, these single events will show a single entry per row (e.g. every time a file is opened).
◈ Queries that aggregate values or metrics for a specific window of time as a threshold by aggregating single events (e.g. 10 files opened in the past five minutes), or the values of a metric (e.g. total AUs assigned to jobs).

Here are some sample queries, the first two return events while the third aggregate values:

◈ This query returns a new entry every time a new Data Lake Store folder is created in the specified Azure Data Lake Store (ADLS) account:

AzureDiagnostics
| where Category == "Requests"
| where ResourceProvider == "MICROSOFT.DATALAKESTORE"
| where Resource == "[Your ADLS Account Name]"
| where OperationName == "mkdirs"

◈ This query returns a new entry every time a job fails in any of the Data Lake Analytics accounts configured to the Log Analytics workspace:

AzureDiagnostics
| where ResourceProvider == "MICROSOFT.DATALAKEANALYTICS"
| where OperationName == "JobEnded"
| where ResultType == "CompletedFailure"

◈ This query returns a list of jobs submitted by users in a 24-hour interval, including user account and sum of jobs submitted in the 24h interval:

AzureDiagnostics
| where ResourceProvider == "MICROSOFT.DATALAKEANALYTICS"
| where OperationName == "SubmitJob"
| summarize AggregatedValue = count(identity_s) by bin(TimeGenerated, 24h), identity_s

Azure Tutorials and Materials, Azure Learning, Azure Certifications, Azure Analytics

Queries like these will be used in the next step when configuring alerts.

Queries like these will be used in the next step when configuring alerts.


Step 3: Create an alert to be notified when the event is detected or when the threshold is reached.
Using a query such as those shown in the previous step, Log Analytics can be used to create an alert that will notify users via e-mail, text message, or webhook when the event is captured or metric threshold is reached.

Please note that the alerts will be slightly delayed and you can read more details regarding the delays and Log Analytics SLAs in Understanding alerts in Log Analytics.

Azure Tutorials and Materials, Azure Learning, Azure Certifications, Azure Analytics

Tuesday 22 May 2018

Detect malicious activity using Azure Security Center and Azure Log Analytics

We have heard from our customers that investigating malicious activity on their systems can be tedious and knowing where to start is challenging. Azure Security Center makes it simple for you to respond to detected threats. It uses built-in behavioral analytics and machine learning to detect threats and generates alerts for the attempted or successful attacks. As discussed in a previous post, you can explore the alerts of detected threats through the Investigation Path, which uses Azure Log Analytics to show the relationship between all the entities involved in the attack. Today, we are going to explain to you how Security Center’s ability to detect threats using machine learning and Azure Log Analytics can help you keep pace with rapidly evolving cyberattacks.

Investigate anomalies on your systems using Azure Log Analytics


One method is to look at the trends of processes, accounts, and computers to understand when anomalous or rare processes and accounts are run on computers which indicates potentially malicious or unwanted activity. Run the below query against your data and note that what comes up is an anomaly or rare over the last 30 days. This query shows the processes run by computers and account groups over a week to see what is new and compare it to the behavior over the last 30 days. This technique can be applied to any of the logs provided in the Advanced Azure Log Analytics pane. In this example, I am using the Security Event table.

Please note the items in bold are an example of filtering your own results for noise and is not specifically required. The reason I have included it is to make it clear there will be certain items that are not run often and show up as anomalous when using this or similar queries, which are specific to your environment and may need manual exclusion to help focus the investigation. Please build your own list of “known good” items to filter out based on your environment.

let T = SecurityEvent
| where TimeGenerated >= ago(30d)
| extend Date = startofday(TimeGenerated)
| extend Process = ProcessName
| where Process != ""
| where Process != "-"
| where Process !contains "\\Windows\\System"
| where Process !contains "\\Program Files\\Microsoft\\"
| where Process !contains "\\Program Files\\Microsoft Monitoring Agent\\"
| where Process !contains "\\ProgramData\\"
| where Process !contains "\\Windows\\WinSxS\\"
| where Process !contains "\\Windows\\SoftwareDistribution\\"
| where Process !contains "\\mpsigstub.exe"
| where Process !contains "\\WindowsAzure\\GuestAgent"
| where Process !contains "\\Windows\\Servicing\\TrustedInstaller.exe"
| where Process !contains "\\Windows\\Microsoft.Net\\"
| where Process !contains "\\Packages\\Plugins\\"
| project Date, Process, Computer, Account
| summarize count() by Date, Process, Computer, Account
| sort by count_ desc nulls last;
T
| evaluate activity_counts_metrics(Process, Date, startofday(ago(30d)), startofday(now()), 1d, Process, Computer, Account)
| extend WeekDate = startofweek(Date)
| project WeekDate, Date, Process, PotentialAnomalyCount = new_dcount, Account, Computer
| join kind= inner
(
    T
    | evaluate activity_engagement(Process, Date, startofday(ago(30d)), startofday(now()),1d, 7d)
    | extend WeekDate = startofweek(Date)
    | project WeekDate, Date, Distribution1day = dcount_activities_inner, Distribution7days = dcount_activities_outer, Ratio = activity_ratio*100
)
on WeekDate, Date
| where PotentialAnomalyCount == 1 and Ratio < 100
| project WeekDate, Date, Process, Account, Computer , PotentialAnomalyCount, Distribution1day, Distribution7days, Ratio
| render barchart kind=stacked

When the above query is run, you will receive a TABLE similar to the item below, although the dates and referenced processes will be different. In this example, we can see when a specific process, computer and account had not been seen before based on week over week data for the last 30 days. Specifically, we can see regedit.exe showed up in the week of 4/15 and on the specific date of 4/17, then PowerShell on 4/30 and then Procmon on 4/30 and 5/8 for the first times each week during the last 30 days.

Azure Tutorials and Materials, Azure Learning, Azure Tutorials and Materials

You can also view the results in CHART mode and change the pivot of the bar CHART as seen below. For example, use the drop down and pivot on Computer instead of process and see the computers that launched this process.

Azure Tutorials and Materials, Azure Learning, Azure Tutorials and Materials

Hover to see the specific computer and how many processes showed up for the first time.

Azure Tutorials and Materials, Azure Learning, Azure Tutorials and Materials

In the query above, we look at the items that run across more than one day, which is the ratio of less than 100. This is a way to parse the date and more easily understand the scope of when a process runs on a given computer. By looking at rare items that have run across multiple days, you can potentially detect manual activity by an attacker who is probing your environment for information that will further increase his attack surface.

We can alternatively look at the processes that ran only on 1 day of the last 30 days, which can be done by choosing only ratio == 100 in the above query, simply change the related line to this:

| where PotentialAnomalyCount == 1 and Ratio == 100 

The above change to the query results in a different set of hits for rare processes and may indicate usage of a scripted attack to rapidly gather data from this system, several systems, or may just indicate attacker activity on a single day.

Lastly, we see several interactive processes run, which indicate an interactive logon, for example SQL Mgmt Studio process Ssms.exe. Potentially, this is an unexpected logon to this system and this query can help expose this type of anomaly in addition to unexpected processes.

Azure Tutorials and Materials, Azure Learning, Azure Tutorials and Materials

Once you have identified a computer or account you want to investigate, you can then dig in further on the full data for that computer. This can be done by opening a secondary query window and filtering only on the computer or account that you are interested in. Examples of this would be as follows. At that point, you can see what occurred around the anomalous or rare process execution time. We will select the portping.exe process and narrow the scope of the dates to allow for a closer look.  From the table above, we can see the Date[UTC] circled below. This date is rounded to the nearest day for the query to work properly, but this along with the computer and account used should allow us to focus in on the timeframe of when this was run on the computer.

Azure Tutorials and Materials, Azure Learning, Azure Tutorials and Materials

To focus in on the timeframe, we will use that date to provide our single day range. We can pass the range into the query by using standard date formats indicated below. Click on the + highlighted in yellow and paste the below query into your window.
In the results, the distinct time is marked in red. We will use that in a subsequent query.

SecurityEvent
| where TimeGenerated >= datetime(2018-04-16 00:00:00.000) and TimeGenerated <= datetime(2018-04-16 23:59:59.999)
| where Computer contains "Contoso-2016" and Account contains "ContosoAdmin"
| where Process contains "portping.exe"
| project TimeGenerated, Computer, Account, Process, CommandLine

Azure Tutorials and Materials, Azure Learning, Azure Tutorials and Materials

Now that we have the exact time, we can look at activity occurring with smaller time frames around that date. We usually use +5 minute and -5 minute blocks. For example:

SecurityEvent
| where TimeGenerated >= datetime(2018-04-16 19:10:00.000) and TimeGenerated <= datetime(2018-04-16 19:21:00.000)
| where Computer contains "Contoso-2016" and Account contains "ContosoAdmin"
//| where Process contains "portping.exe"
| project TimeGenerated, Computer, Account, Process, CommandLine

In the results below, we can easily see that someone was logged into the system via RDP. We know this because RDPClip.exe is being launched, which indicated they were copying and pasting between their host and the remote system.

Additionally, we see after the portping.exe activity that they are attempting to modify accounts or password functionality with the command netplwiz.exe or control userpasswords2.

They are then running Procmon.exe to see what other processes are running on the system. Generally this is done to understand what is available to the attacker to further exploit.

Azure Tutorials and Materials, Azure Learning, Azure Tutorials and Materials

At this point, this machine should be taken offline and investigated more deeply to understand the extent of the compromise.

Find hidden techniques commonly deployed by attackers using Azure Log Analytics


Most security experts have seen the techniques attackers use to hide the usage of commands on a system to avoid detection. While there are certainly methods to avoid even showing up on the command line, the obfuscation technique used below is regularly used by various levels of attackers.

Below we will decode a base64 encoded string in the command line data and look for common PowerShell methods that are used in attacks.

SecurityEvent
| where TimeGenerated >= ago(30d)
| where Process contains "powershell.exe" and CommandLine contains " -enc"
|extend b64 = extract("[A-Za-z0-9|+|=|/]{30,}", 0,CommandLine)
|extend utf8_decode=base64_decodestring(b64)
|extend decode =  replace ("\x00","", utf8_decode)
|where decode contains 'Gzip' or decode contains 'IEX' or decode contains 'Invoke' or decode contains '.MemoryStream'
| summarize by Computer, Account, decode, CommandLine

Azure Tutorials and Materials, Azure Learning, Azure Tutorials and Materials

As you can see, the results provide you with details about what was in the encoded command line and potentially what an attacker was attempting to do.

You can now use the details in the above query to see what was running during the same time by adding the time and computer to the same table. This allows you to easily connect it with other activity on the system, the process by which is described just above in detail. One thing to note is that you can add these automatically by expanding the event with the arrow in the first column of the row. Then hover over TimeGenerated and click the + button.
Azure Tutorials and Materials, Azure Learning, Azure Tutorials and Materials

This will add in an entry like so into your query window:

| where TimeGenerated == todatetime('2018-04-24T02:00:00Z')

Modify the range of time like this:

SecurityEvent
| where TimeGenerated >= ago(30d)
| where Computer == "XXXXXXX"
| where TimeGenerated >= todatetime('2018-04-24T02:00:00Z')-5m and TimeGenerated <= todatetime('2018-04-24T02:00:00Z')+5m
| project TimeGenerated, Account, Computer, Process, CommandLine, ParentProcessName
| sort by TimeGenerated asc nulls last

Azure Tutorials and Materials, Azure Learning, Azure Tutorials and Materials

Lastly, connect this to your various alerts using the join to alerts from the last 30 days to see what alerts are associated:

SecurityEvent
| where TimeGenerated >= ago(30d)
| where Process contains "powershell.exe"  and CommandLine contains " -enc"
| extend b64 = extract( "[A-Za-z0-9|+|=|/]{30,}", 0,CommandLine)
| extend utf8_decode=base64_decodestring(b64)
| extend decode =  replace ("\x00","", utf8_decode)
| where decode contains 'Gzip' or decode contains'IEX' or decode contains 'Invoke' or decode contains '.MemoryStream'
| summarize by TimeGenerated, Computer=toupper(Computer), Account, decode, CommandLine
| join kind= inner (
      SecurityAlert | where TimeGenerated >= ago(30d)
      | extend ExtProps = parsejson(ExtendedProperties)
      | extend Computer = toupper(tostring(ExtProps["Machine Name"]))
      | project Computer, AlertName, Description
) on Computer

Azure Tutorials and Materials, Azure Learning, Azure Tutorials and Materials

Security Center uses Azure Log Analytics to help you detect anomalies in your data as well as expose common hiding techniques used by attackers. By exploring more of your data through directed queries like these presented above, you may find anomalies that are both malicious and benign, but in doing so you will have made your environment more secure and have a better understanding of the activity that is going on systems and resources in your subscription.

Saturday 19 May 2018

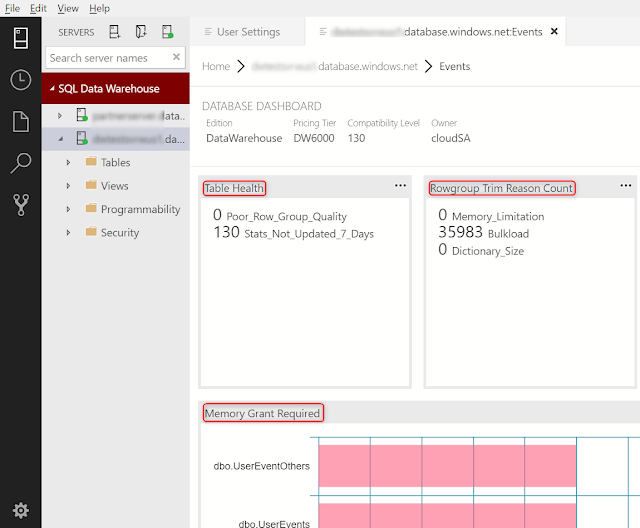
Extract management insights from SQL Data Warehouse with SQL Operations Studio

SQL Operations Studio can be leveraged with Azure SQL Data Warehouse (SQL DW) to create rich customizable dashboard widgets surfacing insights to your data warehouse. This unlocks key scenarios around managing and tuning your data warehouse to ensure it is optimized for consistent performance. Previously, developers had to manually and continuously execute complex DMV queries to extract insights from their data warehouse. This leads to a repetitious process when following development and tuning best practices with SQL DW. Now with SQL Operations Studio, customized insight widgets can be embedded directly within the query tool enabling you to seamlessly monitor and troubleshoot issues with your data warehouse.

The following widgets can be generated by using the provided T-SQL monitoring scripts within SQL Operations Studio for common data warehouse insights.

Data Skew


Detect data skew across distributions to help identify and troubleshoot query performance issues:

SQL Data Warehouse, Microsoft Azure, Azure Certification, Azure Data Warehouse

Columnstore health and statistics


Leverage views to help maximize columnstore row group quality and ensure table statistics are up to date for optimal query performance:

SQL Data Warehouse, Microsoft Azure, Azure Certification, Azure Data Warehouse

User Activity


Identify and understand workload patterns through active sessions queries, queued queries, loads, and backups:

SQL Data Warehouse, Microsoft Azure, Azure Certification, Azure Data Warehouse

Resource Bottlenecks


Ensure adequate resources are allocated such as memory and TempDB:

SQL Data Warehouse, Microsoft Azure, Azure Certification, Azure Data Warehouse

Thursday 17 May 2018

Why developers should enable Azure Security Center’s Just-in-Time VM Access

We are seeing more developers building and running their applications in the public cloud. In fact, companies are using multiple public clouds to run their applications. Our customers tell us that they choose to build applications in Azure because it’s easy to get started and that they have peace of mind knowing the services that their applications rely on will be available, reliable, and secure. Today, we are going to discuss how Azure Security Center’s Just-in-Time VM Access can help you secure virtual machines that are running your applications and code.

Successful attacks on your virtual machines can create serious challenges for development. If a server is compromised, your source code could potentially be exposed, along with the proprietary algorithms or internal knowledge about the application. The pace of development can slow down because your team is focused on recovering from the attack instead of writing and reviewing code. Most importantly, an attack can affect your customers’ abilities to access your applications, impacting your brand and your business. Just-in-Time VM Access can help you reduce your exposure to attacks by limiting the amount of time management ports are open on the virtual machines running your code.

Microsoft Tutorials and Materials, Microsoft Certifications, Microsoft Azure Security

Just-in-Time VM Access can be found under Security Center’s advanced cloud defense features.

When you click on Just-in-Time VM Access, Security Center will automatically discover which virtual machines have Just-in-Time VM Access enabled. By default, it’s going to recommend that you block access to management ports, as those are most commonly attacked, but you can specify access to any port that you want to grant access to, the protocol for connecting, where you can connect from, and for how long.

Microsoft Tutorials and Materials, Microsoft Certifications, Microsoft Azure Security

Microsoft Tutorials and Materials, Microsoft Certifications, Microsoft Azure Security

To request access to a port on a virtual machine that has Just-in-Time VM Access enabled, you can visit the Configured tab of Just-in-Time VM Access or execute a PowerShell cmdlet. You can set permissions for certain users in your organization to only be able to do certain tasks. Even once access has been requested and granted, you can limit the amount of time this user can spend with the virtual machine.

Based on the rules set, you specify what port you need to access, where the request is going to come from, and the time range. The request cannot exceed the maximum time set. If the request complies with the rules set, you receive access to the virtual machine. Just-in-Time VM Access keeps the ports on VMs open for the bare minimum of time needed to complete a task and then it’s automatically closed, drastically reducing your available surface area for attack.

Tuesday 15 May 2018

Enhance productivity using Azure Data Factory Visual Tools

With Azure Data Factory (ADF) visual tools, we listened to your feedback and enabled a rich, interactive visual authoring and monitoring experience. It allows you to iteratively create, configure, test, deploy and monitor data integration pipelines without any friction. The main goal of the ADF visual tools is to allow you to be productive with ADF by getting pipelines up and running quickly without requiring to write a single line of code.

We continue to add new features to increase productivity and efficiency for both new and advanced users with intuitive experiences. You can get started by clicking the Author and Monitor tile in your provisioned v2 data factory blade.

Azure Tutorials and Materials, Azure Guides, Azure Learning, Azure Certifications, Azure Data Factory

Check out some of the exciting new features enabled with data factory visual tools since public preview (January 2018):

Latest data factory updates


Follow exciting new updates to the data factory service.

Azure Tutorials and Materials, Azure Guides, Azure Learning, Azure Certifications, Azure Data Factory

View Data Factory deployment region, and resource group. Then, switch to another data factory that you have access to.

Azure Tutorials and Materials, Azure Guides, Azure Learning, Azure Certifications, Azure Data Factory

Visual authoring


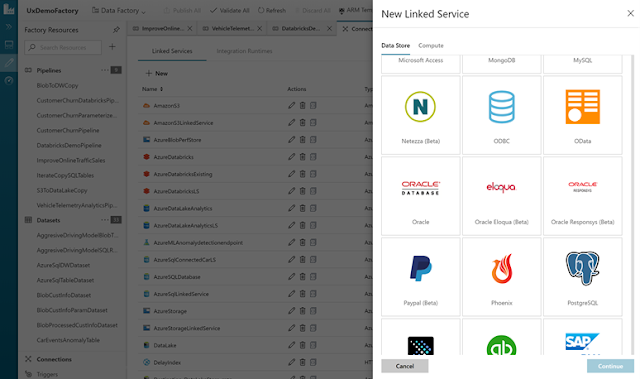
More data connectors

Ingest data at scale from more than 70 on-premises/cloud data sources in a serverless fashion.

Azure Tutorials and Materials, Azure Guides, Azure Learning, Azure Certifications, Azure Data Factory

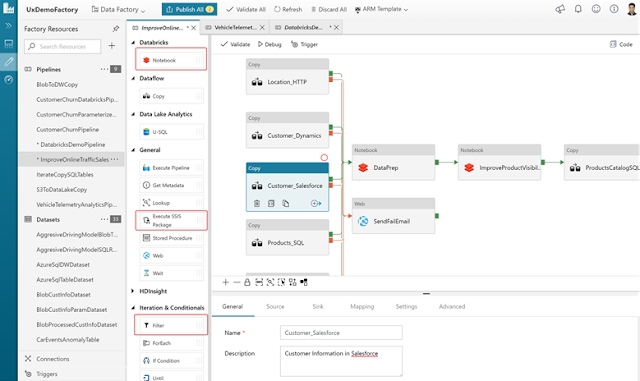
New activities in toolbox

■ Notebook Activity: Ingest data at scale using more than 70 on-premises/cloud data sources and prepare/transform the ingested data in Azure Databricks as a Notebook activity step in data factory pipelines.
■ Filter Activity: Filter data ingested from more than 70 data sources.
■ Execute SSIS Package: Execute SSIS packages on Azure SSIS Integration Runtime in your data factory.
■ Look up Activity: Lookup activity now supports retrieving a dataset from any of 70+ ADF-supported data sources.

Azure Tutorials and Materials, Azure Guides, Azure Learning, Azure Certifications, Azure Data Factory

Azure Key Vault integration


Store credentials for your data stores and computes referred in Azure Data Factory pipelines in an Azure Key Vault. Simply create Azure Key Vault linked service and refer to the secret stored in the Key vault in your data factory pipelines.

Azure Tutorials and Materials, Azure Guides, Azure Learning, Azure Certifications, Azure Data Factory

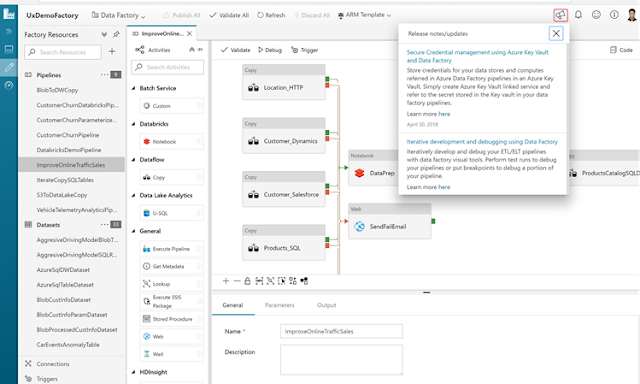
Iterative development and debugging


Iteratively develop and debug your ETL/ELT pipelines with data factory visual tools. Perform test runs to debug your pipelines or put breakpoints to debug a portion of your pipeline.

View test run (debug) status on activity nodes


You can now view the the last test run status on activity nodes on the pipeline canvas.

Azure Tutorials and Materials, Azure Guides, Azure Learning, Azure Certifications, Azure Data Factory

Clone pipelines and activities


You can now clone an entire pipeline or an activity on the pipeline canvas. This will create an identical copy of the entire pipeline or an activity on the pipeline canvas including the settings.

Azure Tutorials and Materials, Azure Guides, Azure Learning, Azure Certifications, Azure Data Factory

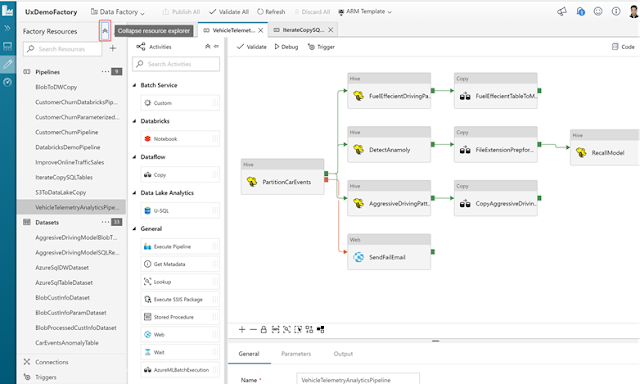
New Resource Explorer actions


You can now expand/collapse all the resource explorer entities (pipelines, datasets) with a click of a button. You can also adjust the width of the ‘Resource Explorer’ by dragging it to the left/right.

Azure Tutorials and Materials, Azure Guides, Azure Learning, Azure Certifications, Azure Data Factory

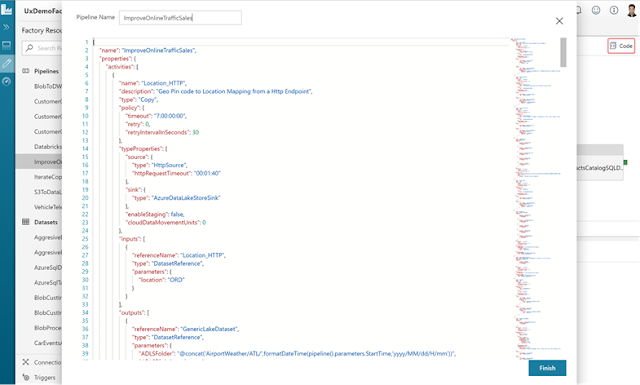
View/edit Code for your data factory pipelines


You can now view and edit JSON for your data factory pipelines. Simply click the ‘Code’ icon to view your JSON, make edits directly to your JSON and click ‘Finish.’ You can then ‘Publish’ your changes to the data factory service.

Azure Tutorials and Materials, Azure Guides, Azure Learning, Azure Certifications, Azure Data Factory

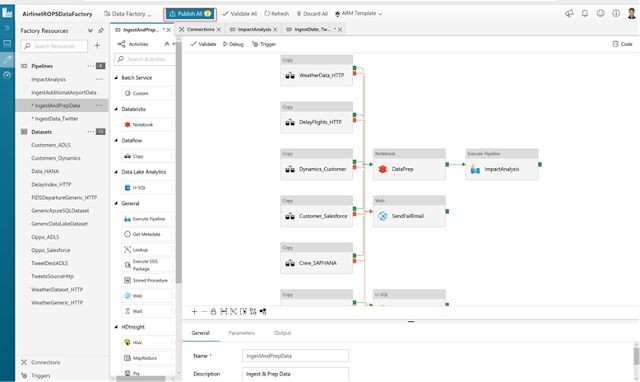
View pending changes to be published to data factory


Add/edit/delete pipelines, triggers, datasets, linked services, integration runtimes and see the number of pending changes to be published to the data factory service.

Azure Tutorials and Materials, Azure Guides, Azure Learning, Azure Certifications, Azure Data Factory

Import data factory resources to any branch in your GIT repository


You can now choose the collaboration branch (generally ‘master’), create a new branch or use any existing branch to import your data factory resources while setting up the VSTS GIT repository. This is very useful in case you don’t have access to the collaboration branch and want the data factory resources imported in any other develop/feature branch.

Azure Tutorials and Materials, Azure Guides, Azure Learning, Azure Certifications, Azure Data Factory

Visual Monitoring


Monitor Copy real time progress

Click the ‘Details’ icon to view your copy activity continuous progress. Simply click ‘Refresh’ to get the latest statistics.

Azure Tutorials and Materials, Azure Guides, Azure Learning, Azure Certifications, Azure Data Factory

Azure Tutorials and Materials, Azure Guides, Azure Learning, Azure Certifications, Azure Data Factory

Alerts

Create alerts to be notified on different data factory metrics. For example: pipeline, activity, trigger failure runs. Clicking ‘Alerts’ will take you to the ‘Monitor’ tab in azure portal where you can create alerts on data factory metrics.

Azure Tutorials and Materials, Azure Guides, Azure Learning, Azure Certifications, Azure Data Factory

Metrics

Visualize your data factory metrics and see the pattern over days, months, and more in a simple graphical interface. Clicking ‘Metrics’ will take you to the ‘Monitor’ tab in azure portal where you can visualize your data factory metrics.

Azure Tutorials and Materials, Azure Guides, Azure Learning, Azure Certifications, Azure Data Factory

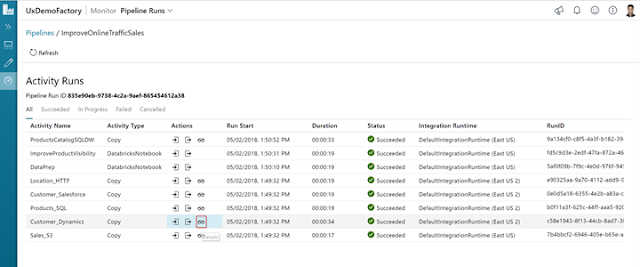
View run status of child pipelines

If your pipeline triggers other child pipelines using ‘Execute Pipeline’ activity in data factory, you can now view the status of child pipelines from the parent pipeline. Simply click the ‘Output’ icon under the ‘Actions’ column and click on the ‘pipelineRunId’ field.

Azure Tutorials and Materials, Azure Guides, Azure Learning, Azure Certifications, Azure Data Factory

Easily copy ‘runid’ for debugging purpose

You can now copy the ‘runid’ of your pipeline, activity runs easily for debugging purposes. Simply select and copy it in case you need to provide it to azure support for debugging purposes.

Azure Tutorials and Materials, Azure Guides, Azure Learning, Azure Certifications, Azure Data Factory