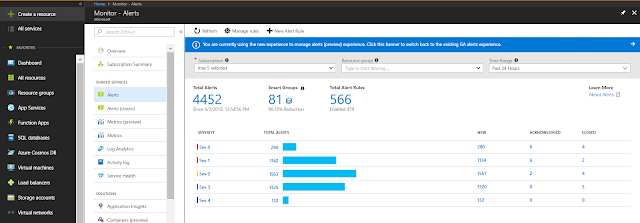
We are excited to announce preview of three new features in Azure Monitor that let you enumerate alerts at scale across log, metric or activity log alerts, filter alerts across subscriptions, manage alert states, look at alert instance specific details, and troubleshoot issues faster using SmartGroups that automatically group related alerts. These features continue to enhance the unified alerts configuration experience announced earlier this year. We look forward to your feedback to refine the functionality further.
The new alert enumeration experience and API allows observing alerts across Azure deployments. Alerts across multiple subscriptions can be queried and pivoted on severity, signal types, resource type, and more allowing a performant and easy summary-to-drill down experience. The new enumeration experience also supports multi-select filtering on any relevant dimension, allowing for example, looking up alerts across a set of resource groups or specific resource types.
The new alert enumeration experience and API allows observing alerts across Azure deployments. Alerts across multiple subscriptions can be queried and pivoted on severity, signal types, resource type, and more allowing a performant and easy summary-to-drill down experience. The new enumeration experience also supports multi-select filtering on any relevant dimension, allowing for example, looking up alerts across a set of resource groups or specific resource types.
Alert state management provides users a way to change the state of the alert to reflect the current situation of the issue in their environment. Currently three alert states are supported – New, Acknowledged, and Closed.
Alert states are separate from the monitoring condition, which is updated by the underlying monitoring service that detected the issue. Monitoring condition supports two values – fired and resolved.
The history of both monitor condition and alert state changes, as well as the details of the event such as target resource uri, alert rule, monitor condition, and link to query for log alerts, are captured in the payload of the alert to aid in triaging and auditing.
Smart Groups are system generated alerts that encapsulate many related alerts to reduce alert noise and help in mitigating events faster. These Smart Groups are automatically created using machine learning algorithms looking for similarity and co-occurrence patterns among alerts originating from a monitor service (e.g. LA or Platform). Smart Groups have the same properties as an individual alert such as user defined states or history. For an operator, smart groups significantly reduce the number of alerts to analyze by focusing on only a handful of groups. For example, if % CPU on several virtual machines in a subscription simultaneously spikes leading to many individual alerts, and if such alerts have occurred together anytime in the past, these alerts will likely be grouped into a single Smart Group, suggesting a potential common root cause. This technology has gone through extensive testing against hyperscale Azure services with very good results.


0 comments:
Post a Comment