Tuesday 30 October 2018

Design patterns – IoT and aggregation

In this article, you will learn how to insert IoT data with high throughput and then use aggregations in different fields for reporting. To understand this design pattern, you should already be familiar with Azure Cosmos DB and have a good understanding of change feed, request unit (RU), and Azure Functions.

Many databases achieve extremely high throughput and low latency because they partition the data. This is true for all NoSQL database engines like MongoDB, HBase, Cassandra, or Azure Cosmos DB. All these databases can scale out unlimitedly because of partitioning or sharding.

Let us look at Azure Cosmos DB more closely. On the top level, a container is defined. You can think of container as a table, a collection, or a graph but this is the main entity which holds all the information. Azure Cosmos DB uses the word “container” to define this top-level entity, and because Azure Cosmos DB is a multi-model database this container is synonymous with collections for SQL, MongoDB, and Graph APIs, and Tables for Cassandra or Table APIs.

A collection has many physical partitions which are allocated based on the throughput requirement of the collection. Today, for 10000 RU you may get ten partitions, but this number may change tomorrow. You should always focus on the throughput you want and should not worry about the number of partitions you got allocated, as I said, this number of partitions will change with data usage.

To achieve high scale throughput and low latency, you need to specify a partition key and row key while inserting the data and use the same partition key and row key while reading the data. If you choose the right partition key then your data will be distributed evenly across all the partitions, and the read and write operations can be in single digit milliseconds.

Internally, Azure Cosmos DB uses hash-based partitioning. When you write an item, Azure Cosmos DB hashes the partition key value and uses the hashed result to determine which partition to store the item in. A good partition key will distribute your data equally among all the available partitions as shown in the figure below.

Azure Tutorial and Material, Azure Certification, Azure Study Material

Good partition key, data is equally distributed

One to one mapping between partition keys and physical partitions doesn’t exist, meaning a single physical partition can store many keys. This is because on is a logical concept (partition key) and the other is a physical concept. Often novice users think that a partition key is equal to a physical partition. Please remember, one is a logical concept and the other is a physical concept, they are not mapped one to one. Each key is hashed and then using modulo operators, it is mapped to a partition. Each logical partition can store 10 GB of data, this limit may change in future and will automatically split when the data grows to more than 10 GB. Though you never have to worry about splitting partitions yourself, Azure Cosmos DB does it behind the scene. However, you should never have a partition key that may have more than 10 GB of data. 

A million partition keys will not create a million physical partitions.

Now, let’s look at an example. You are working in an IoT company, which has IoT devices installed in buildings to maintain the temperature, and you have hundreds of thousands of customers all around the world. Each customer has thousands of IoT devices which are updating the temperature every minute. Let’s define how the data will look:

{
     CustomerId: Microsoft,
     DeviceId: XYZ-23443,
     Temperature: 68
     DateTime: 32423512
}

Imagine you have a customer which is a global company with offices in every country and has 100,000 IoT devices distributed. These devices are sending 2 KB of data every minute for a daily total of 2 GB. At this rate, you may fill the partition in five days. you can use a time to live (TTL) mechanism to delete the data automatically, but for our example let’s assume you have to keep this data for 30 days.

If you choose “CustomerId” as the partition key, you will see your data is skewed for large customers and your partitions will look as shown below.

Azure Tutorial and Material, Azure Certification, Azure Study Material

This kind of partitioning will also create throttling for large customers, who have thousands of IoT devices and are inserting the data in a collection partitioned on “CustomerId”. You may wonder why it will be throttled? To understand that, imagine your collection is defined to have 5000 RU/Sec and you have five partitions. This means each partition throughput can have 1000 RU.

Please note, we said here five partitions but this number is again here for discussion's sake. This number may change in the future for your throughput. With the change in hardware, tomorrow you may just get three partitions or one for 5000 RU. Remember, these physical partitions are not constant, they will keep splitting automatically as your data will keep growing.

Users often make this mistake and then complain that they are being throttled at 2000 RU even if they have provisioned the collection for 5000 RU. In this scenario, the main issue is their data is not partitioned properly and they are trying to insert 2000 RU into one partition. This is why you need to have a good partition key that can distribute your data evenly across all partitions.

If “CustomerId” is not a good partition key, then what other keys we can use? You will also not like to partition the data on “DateTime”, because this will create a hot partition. Imagine you have partitioned the data on time, then for a given minute, all the calls will hit one partition. If you need to retrieve the data for a customer then it will be a fan-out query because data may be distributed on all the partitions.

To choose the right partition keys, you must think and optimize for read or write scenarios. For simpler scenarios, it is possible to get a partition key for both read and write scenarios. However, if that is not the case then you must compromise and optimize for one of the scenarios.

In this article, we are exploring the scenario in which we do not have one right partition key for both read and write. Let’s see what we can do to satisfy both the read and write requirements.

In this scenario, we have to optimize for writing because of a high number of devices sending us the data. It is best to define the collection with “DeviceId” as the partition key for fast ingestion. “DeviceId” is not only unique but also more granular than “CustomerId”. Always look for a key with more cardinality or uniqueness so your data will be distributed across all partitions. However, what if for reporting you want to do aggregation over “CustomerId”?

This is the crux of this blog. You would like to partition the data for the insert scenario and also group the data on a different partition key for the reporting scenario. Unfortunately, these are mismatched requirements.

Imagine, you have inserted the data with “DeviceId” as the partition key, but if now you want to group by temperature and “CustomerId”, your query will be a cross-partition query. Cross-partition queries are ok for once a while scenario. Since all data is indexed by default in Azure Cosmos DB, cross-partition queries are not necessarily bad things, but they can be expensive. Cross-partition queries cost you much more RU/s than point lookups.

You have two options to solve this problem. Your first option is to use Azure Cosmos DB’s change feed and Azure Function to aggregate the data per hours and then store the aggregated data in another collection, where “CustomerId” is the partition key.

Azure Tutorial and Material, Azure Certification, Azure Study Material

Change Feed

You can again listen to the change feed of reports per hour collection to aggregate the data for per day and store the aggregation in another Azure Cosmos DB reports per day. IoT devices send data directly to Cosmos DB. This pattern is possible because of change feed. Change feed exposes the log of Cosmos DB. The change feed includes inserts and updates operations made to documents within the collection. Read more about change feed. However, please know that change feed is enabled by default for all account and for all collections.

To learn more about how to use change feed and azure function, check this screen cast.

The second option is to use Spark, to do the aggregation, and keep the aggregated value in SQL data warehouse or a second collection where the partition key is CustomerId.

Azure Tutorial and Material, Azure Certification, Azure Study Material

This option will also use the change feed. From Spark, you can connect directly to change feed and get all the changes in Spark at the real-time. Once the data is in Spark, you can do the aggregation and then write that data back to Azure Cosmos DB or to SQL Data Warehouse.

Here is the code snippet for Spark to read the data from Azure Cosmos DB, do the aggregation and write back the data.

# Base Configuration
iotConfig = {
"Endpoint" : "https://xx.documents.azure.com:443/",
"Masterkey" : "E0wCMaBIz==",
"Database" : "IoT",
"preferredRegions" : "Central US;East US2",
"Collection" : "IoT",
"checkpointLocation" : "dbfs://checkpointPath"
}
# Connect via Spark connector to create Spark DataFrame
iot_df = spark.read.format("com.microsoft.azure.cosmosdb.spark").options(**iotConfig).load()
iot_df.createOrReplaceTempView("c")
psql = spark.sql ("select DeviceId, CustomerId, Temp from c")

writeConfig = {
"Endpoint" : "https://xx.documents.azure.com:443/",  
"Masterkey" : "E0wCMaBKdlALwwMhg==",
"Database" : "IoT",
"preferredRegions" : "Central US;East US2",
"Collection" : "MV",
"Upsert" : "true"
     }
iot_df.createOrReplaceTempView("c")
psql = spark.sql ("select CustomerId, avg(temp) as Temp_Avg from c group by c.CustomerId ")
psql.write.format("com.microsoft.azure.cosmosdb.spark").mode('append').options(**writeConfig).save()

Check the screen cast to learn how to use Spark with Azure Cosmos DB.

Both the options can give you per minute aggregation by listening to the live change feed. Depending upon your reporting requirement, you can keep different aggregations at different levels in different collections or in the same collection. This is another option you can have to keep these aggregated values to SQL data warehouse.

Wednesday 24 October 2018

Azure Update Management: A year of great updates

Azure Update Management is a service included as part of your Azure Subscription that enables you to assess your update status across your environment and manage your Windows and Linux server patching from a single pane of glass, both for on-premises and Azure.

Update Management is available at no additional cost (you only pay for log data stored in the Azure Log Analytics service) and can easily be enabled on Azure and on-premises VMs. To try it, simply navigate to your VM tab in Azure and enable Update management on one or more of your machines.

Over the past year we’ve been listening to your feedback and bringing powerful new capabilities to Azure Update Management. Here’s a look at some of the new features we have developed with your help.

Groups


One of the biggest asks from the community this year is for more flexibility in targeting update deployments, specifically support for groups with dynamic membership. Instead of specifying a static set of machines when you create an update deployment, groups allow you to specify a query that will be evaluated each time an update deployment occurs.

We have released a preview feature that enables you to create an Azure-native query that targets onboarded Azure VMs using flexible Azure-native concepts. For instance, in the following screenshot a query is configured to automatically pick up onboarded VMs that have the tag PatchWindow=SundayNight. As you onboard new VMs, you can simply add this tag and the VMs will automatically start participating in the next patch cycle for this update deployment.

Azure Tutorial and Material, Azure Certification, Azure Guides, Azure Study Material, Azure Learning

We’ve also added the ability to immediately preview your query while authoring the update deployment. This shows the VMs that would be patched if this update deployment were to run right now.

Azure Tutorial and Material, Azure Certification, Azure Guides, Azure Study Material, Azure Learning

Onboarding new machines


From the virtual machines view you can easily onboard multiple machines into Update Management, even across subscriptions

Azure Tutorial and Material, Azure Certification, Azure Guides, Azure Study Material, Azure Learning

Pre/post scripts


One of the big asks from the community is for the ability to run custom tasks before and after an update deployment. Some of the more common scenarios include starting VMs before deploying updates (another top UserVoice request), starting and stopping services on machines, and starting a backup job before deploying updates.

To address this, we added “pre/post scripts,” a way to invoke Azure automation runbooks as part of an update deployment.

Azure Tutorial and Material, Azure Certification, Azure Guides, Azure Study Material, Azure Learning

Update inclusion


Azure Update Management provides the ability to deploy patches based on classifications. However, there are scenarios where you may want to explicitly list the exact set of patches. Common scenarios include whitelisting patches after canary environment testing and zero-day patch rollouts.

With update inclusion lists you can choose exactly which patches you want to deploy instead of relying on patch classifications.

Azure Tutorial and Material, Azure Certification, Azure Guides, Azure Study Material, Azure Learning

Reboot control


Patches often require reboots. Unfortunately reboots affect application availability. We’ve gotten feedback that you would like the ability to control when those reboots happen; reboot control is the result.

With the new reboot control feature, we provide you with flexible options for controlling your reboots. You can suppress reboots during an update run, always reboot, or even create a separate update deployment that only reboots your servers and doesn’t install any patches. With this functionality, the downtime caused by server reboots can be decoupled from your patching cycle.

Some of you have also given the feedback that you want to control reboots yourself, ensuring services are taken down and brought up in a manner consistent with your internal controls. Using the pre/post scripts feature in conjunction with reboot control is a great way to suppress reboots during the patch cycle then do an orchestrated reboot of your servers as a post script.

Saturday 20 October 2018

ONNX Runtime for inferencing machine learning models now in preview

We are excited to release the preview of ONNX Runtime, a high-performance inference engine for machine learning models in the Open Neural Network Exchange (ONNX) format. ONNX Runtime is compatible with ONNX version 1.2 and comes in Python packages that support both CPU and GPU to enable inferencing using Azure Machine Learning service and on any Linux machine running Ubuntu 16.

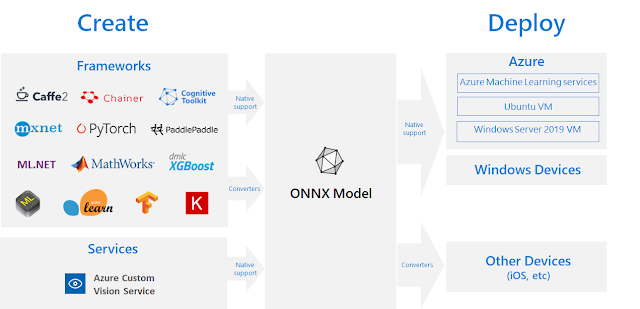
ONNX is an open source model format for deep learning and traditional machine learning. Since we launched ONNX in December 2017 it has gained support from more than 20 leading companies in the industry. ONNX gives data scientists and developers the freedom to choose the right framework for their task, as well as the confidence to run their models efficiently on a variety of platforms with the hardware of their choice.

Microsoft Tutorial and Materials, Microsoft Certification, Azure Learning, Azure Study Materials

The ONNX Runtime inference engine provides comprehensive coverage and support of all operators defined in ONNX. Developed with extensibility and performance in mind, it leverages a variety of custom accelerators based on platform and hardware selection to provide minimal compute latency and resource usage. Given the platform, hardware configuration, and operators defined within a model, ONNX Runtime can utilize the most efficient execution provider to deliver the best overall performance for inferencing.

The pluggable model for execution providers allows ONNX Runtime to rapidly adapt to new software and hardware advancements. The execution provider interface is a standard way for hardware accelerators to expose their capabilities to the ONNX Runtime. We have active collaborations with companies including Intel and NVIDIA to ensure that ONNX Runtime is optimized for compute acceleration on their specialized hardware. Examples of these execution providers include Intel's MKL-DNN and nGraph, as well as NIVIDIA's optimized TensorRT.

Microsoft Tutorial and Materials, Microsoft Certification, Azure Learning, Azure Study Materials

The release of ONNX Runtime expands upon Microsoft's existing support of ONNX, allowing you to run inferencing of ONNX models across a variety of platforms and devices.

Azure: Using the ONNX Runtime Python package, you can deploy an ONNX model to the cloud with Azure Machine Learning as an Azure Container Instance or production-scale Azure Kubernetes Service. 

.NET: You can integrate ONNX models into your .NET apps with ML.NET.

Windows Devices: You can run ONNX models on a wide variety of Windows devices using the built-in Windows Machine Learning APIs available in the latest Windows 10 October 2018 update.

Microsoft Tutorial and Materials, Microsoft Certification, Azure Learning, Azure Study Materials

Using ONNX


Get an ONNX model


Getting an ONNX model is simple: choose from a selection of popular pre-trained ONNX models in the ONNX Model Zoo, build your own image classification model using Azure Custom Vision service, convert existing models from other frameworks to ONNX, or train a custom model in AzureML and save it in the ONNX format.

Microsoft Tutorial and Materials, Microsoft Certification, Azure Learning, Azure Study Materials

Inference with ONNX Runtime


Once you have a trained model in ONNX format, you're ready to feed it through ONNX Runtime for inferencing. The pre-built Python packages include integration with various execution providers, offering low compute latencies and resource utilization. The GPU build requires CUDA 9.1.

To start, install the desired package from PyPi in your Python environment:

pip install onnxruntime 
pip install onnxruntime-gpu

Then, create an inference session to begin working with your model.

import onnxruntime
session = onnxruntime.InferenceSession("your_model.onnx")  

Finally, run the inference session with your selected outputs and inputs to get the predicted value(s).

prediction = session.run(None, {"input1": value})

Thursday 18 October 2018

What's new in Azure Media Services video processing

Developers and media companies trust and rely on Azure Media Services for the ability to encode, protect, index, and deliver videos at scale. This week we are proud to announce several enhancements to Media Services including the general availability of the new Azure Media Services v3 API, as well as updates to Azure Media Player.

Low-latency live streaming, 24-hour transcoding, CMAF, and a shiny new API (v3) ready for production


The Azure Media Services v3 API was announced at the Build conference in May 2018, which provided a simplified development model, enabled a better integration experience with key Azure services like Event Grid and Functions, and much more. The API is now generally available and comes with many new exciting features. You can begin migrating workloads built on the preview API over to production use today.

What’s new?


The new Media Services v3 API is a major milestone in the enhancement of the developer experience for Media Services customers. The new API provides a set of SDKs for .NET, .NET Core, Java, Go, Python, Ruby, and Node.js! In addition, the API includes support for the following key scenarios.

Low-latency live streaming with 24-hour transcoding


LiveEvent, the replacement for the Channel entity in the v2 API, now has several major service enhancements.

We often receive the request to lower the latency when streaming live events. Our new low-latency live streaming mode is now available exclusively on the LiveEvent entity in our v3 API. It supports 8 seconds end-to-end latency when used in combination with Azure Media Player’s new low-latency heuristic profile, or ~10 seconds with native HLS playback on an Apple iOS device. Simply configure your live encoder to use smaller 1-second GOP sizes, and you can quickly reduce your overall latency when delivering content to small or medium sized audiences. Of course, it should be noted that the end-to-end latency can vary depending on local network conditions or by introducing a CDN caching layer. Test your exact configuration as your latency could vary.

Looking forward, we will continue to make improvements to our low-latency solution. Last month we announced that we are joining the open source SRT Alliance to help improve low-latency live streaming to Azure with secure and reliable ingest to the cloud. As part of this announcement we have already begun work to add SRT ingest protocol support to our LiveEvent.

To use the new LowLatency feature, you can set the StreamOptionsFlag to LowLatency on the LiveEvent:

Azure Media Services, Azure Guides, Azure Certification, Azure Study Materials

Once the stream is up and running, use the Azure Media Player Demo page, and set the the playback options to use the “Low Latency Heuristics Profile”.

Azure Media Services, Azure Guides, Azure Certification, Azure Study Materials

Next, when streaming live video, you have two options for long-duration streaming events. If you need to provide linear (24x7x365) live streams, you should use an on-premises encoder with our “pass-through”, non-transcoding LiveEvent. If you require live encoding in the cloud, in the v2 API you were limited to 8 hours of running time. We are very pleased to announce that we have increased support for live transcoding durations up to a full 24 hours when using the new LiveEvent.

Lastly, we have verified several updated RTMP(s)-based encoders including the latest releases from MediaExcel, Telestream Wirecast, Haivision KB, and Switcher Studio.

Easier development with Event Grid and Azure Resource Manager


To make your development experience easier across Azure solutions for media, we are offering more notifications for common operations through Azure Event Grid. You can now subscribe to state change events from Job and JobOutput operations in order to better integrate your custom media applications. If you are creating custom workflows in a Transform, you can specify your own correlation data in the Job object. This correlation data can be extracted from the notifications received through Event Grid to help create workflows that solve common problems with multi-tenant applications, or integration with 3rd-party media asset management systems. When monitoring a live stream, you can use new events such as live ingest heartbeat, connected and disconnected events from the upstream live encoder.

Subscribe to any Media Services event through code, Logic Apps, Functions, or via the Azure portal.

Azure Media Services, Azure Guides, Azure Certification, Azure Study Materials

With the transition over to Azure Resource Management (ARM) for our v3 API, you get the following benefits when managing transforms, live events, DRM keys, streaming endpoints, and assets:

1. Easier deployment using ARM templates.
2. Ability to apply role-based access control (RBAC).

Simplified ingest and asset creation


Ingesting content into Media Services used to involve multiple steps such as copying files to Azure Storage, and creating Assets and AssetFiles. In the new API, you can simply point to an existing file in Azure Storage using a SAS URL, or you can ingest from any HTTP(s) accessible URL.

var input = new JobInputHttp(
                     baseUri: "https://nimbuscdn-nimbuspm.streaming.mediaservices.windows.net/2b533311-b215-4409-80af-529c3e853622/",
                     files: new List<String> {"Ignite-short.mp4"}
                     );

We have also simplified the creation of assets in Azure Blob Storage by allowing you to set the container name directly. You can then use the storage APIs to add files into the container. Existing v2 assets will continue to work in the new API, but v3 assets are not backwards compatible.

Streaming and Dynamic Packaging with MPEG CMAF


In the service, we have now released official support for the latest MPEG Common Media Application Format (CMAF) with ‘cbcs’ encryption. CMAF, officially known as MPEG-A Part 19 or ISO/IEC 23000-19, is a new multimedia file format that provides storing and delivery of streaming media using a single encrypted, adaptive bitrate format to a wide range of devices including Apple iPhone, Android, and Windows. Streaming service providers will benefit from this common format through improved interoperability, low-latency streaming, and increased CDN cache efficiency.

To use the new CMAF format, simply add the following new “format=” tag to the URL of your streaming URLs and choose the appropriate manifest type of HLS (for iOS devices) or DASH (for Windows or Android devices).

For MPEG DASH manifest with CMAF format content, use “format=mpd-time-cmaf” as shown below:

https://<<your-account-name>>.streaming.media.azure.net/<<locator-ID>>/<<manifest-name>>.ism/manifest(format=mpd-time-cmaf)

For HLS manifest with CMAF format content use “format=m3u8-cmaf” as shown below:

https://<<your-account-name>>.streaming.media.azure.net/<<locator-ID>>/<<manifest-name>>.ism/manifest(format=m3u8-cmaf)

Manage Media Services through the Command Line


Finally, we have updated the Azure CLI 2.0 module for Media Services to include all features of the v3 API. We will be releasing the final Media Services CLI module on October 23, 2018 for download, or for use directly within the Cloud Shell. The CLI is designed to make scripting Media Services easy. Use the CLI to query for running Jobs, creating Live Events, creating custom Transforms, managing content keys, and more. The CLI module also includes support for Streaming Endpoints, content key policies, and dynamic manifest filters.

Azure Media Services, Azure Guides, Azure Certification, Azure Study Materials

Wednesday 17 October 2018

Accessibility and array support with Azure Blockchain Workbench 1.4.0

We’ve been very grateful for the feedback you’ve given us since we first introduced Azure Blockchain Workbench in public preview a few months ago. Your feedback continues to be an essential and impactful part of our work. For this release, we focused on making Workbench more accessible for everyone. Accessibility is a key pillar in our vision of empowering every person and every organization to achieve more. We are excited to share some of the improvements we’ve made with accessibility in mind.

To use 1.4, you can either deploy a new instance of Workbench through the Azure Portal or upgrade your existing deployment to 1.4.0 using our upgrade script. This update includes the following improvements:

Better accessibility for screen readers and keyboard navigation


Azure Blockchain Workbench is far more than UI within client apps. Workbench provides a rich developer scaffold for you to develop and integrate blockchain solutions within your enterprise.

Azure Blockchain, Azure Certification, Azure Tutorial and Materials, Azure Guides

The Web client gives you an easy to use the environment to validate, test, and view blockchain applications. The application interface is dynamically generated based on smart contract metadata and can accommodate any use case. The client application delivers a user-facing front-end to the complete blockchain applications generated by Blockchain Workbench.

With version 1.4.0, the Web client now fully supports screen readers in terms of navigation and reading information. In addition, we updated the Web client to better support keyboard shortcuts and navigation. We hope these improvements can make you more productive when creating blockchain applications in Workbench.

Customization of smart contract table columns


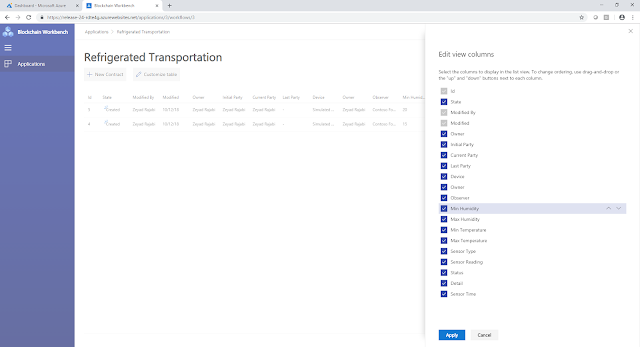
Workbench dynamically creates Web client UI based on your smart contracts and application configuration. Workbench summarizes smart contract instances as a table in the Web client based on the properties specified in the application configuration. Depending on the blockchain scenario, developers may specify a lot of properties for any given application. Unfortunately, if any properties are specified, the smart contract table within the Web client UI will become hard to read due to the size and number of columns of the table, see the below image.

Azure Blockchain, Azure Certification, Azure Tutorial and Materials, Azure Guides

In some cases, properties may be more useful from a reporting perspective rather than a user experience perspective. To help with the readability of the smart contract tables, we’ve introduced a new feature, which allows users to customize the smart contract table in terms of visible columns and order of columns.

Below is a screenshot of the customized table pane, which allows each user to toggle the visibility of table columns as well as adjust the ordering of columns within the table.

Azure Blockchain, Azure Certification, Azure Tutorial and Materials, Azure Guides

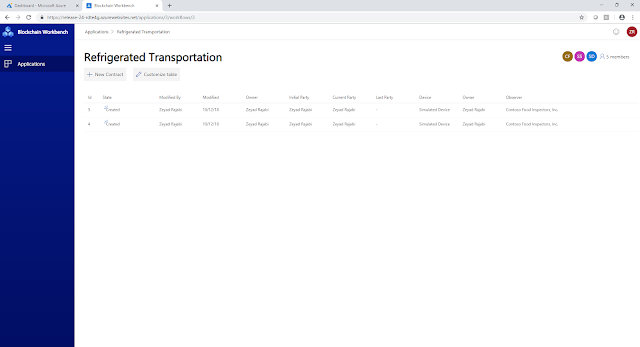
The smart contract table view will reflect all changes applied via the customize table pane.

Azure Blockchain, Azure Certification, Azure Tutorial and Materials, Azure Guides

New supported datatype – Arrays


With 1.4.0, we now support array datatypes as part of constructor and function parameters as well as smart contract properties. Arrays allow you to create blockchain apps where you can input and represent a strongly typed list of content, such as a list of numbers or values.

Workbench currently supports static and dynamic arrays of integers, booleans, money, and time. Workbench does not yet support an array of enums or array of arrays, including strings. Note, for string support we’re waiting for Solidity functionality to get out of preview. Let us know if these limitations are blockers for you.

The array type is specified via the configuration file as follows:

"Properties": [
{
   {
            "Name": "PropertyType",
            "DisplayName": "Property Type",
            "Type": {
            "Name": "array",
                "ElementType": {
                     "Name": "int"
                }
             }
      }
},

There is a limitation is solidity when it comes to public properties related to arrays. If you have a public state variable of an array type, Solidity only allows you to retrieve single elements of the array with auto-generated getter functions. To work around this limitation, you will need to provide an appropriate function to return arrays. For example:

function GetPropertyTypes() public constant returns (int[]) {
         return PropertyType;
}

If this function is not part of your Solidity code, we will show an error when uploading your blockchain application.

Support for strings up to 4k characters


One of the limitations in Workbench is the data type strings can only be 256 characters. We’ve received feedback from folks who wanted us to increase the limit. With 1.4.0, the new limit is 4,000 characters. Note, using more characters will result in using more gas when processing transactions. When building your smart contracts, please be aware of the block gas limit and build your smart contracts with that limit in mind.

Azure Blockchain, Azure Certification, Azure Tutorial and Materials, Azure Guides

Azure Blockchain, Azure Certification, Azure Tutorial and Materials, Azure Guides

Tuesday 16 October 2018

New metric in Azure Stream Analytics tracks latency of your streaming pipeline

Azure Stream Analytics is a fully managed service for real-time data processing. Stream Analytics jobs read data from input sources like Azure Event Hubs or IoT Hub. They can perform a variety of tasks from simple ETL and archiving to complex event pattern detection and machine learning scoring. Jobs run 24/7 and while Azure Stream Analytics provides 99.9 percent availability SLA, various external issues may impact a streaming pipeline and can have the significant business impact. For this reason, it is important to proactively monitor jobs, quickly identify root causes, and mitigate possible issues. In this blog, we will explain how to leverage the newly introduced output watermark delay to monitor mission-critical streaming jobs.

Challenges affecting streaming pipelines


What are some issues that can occur in your streaming pipeline? Here are a few examples:

◈ Data stops arriving or arrives with a delay due to network issues that prevent the data from reaching the cloud.

◈ The volume of incoming data increases significantly and the Stream Analytics job is not scaled appropriately to manage the increase.

◈ Logical errors are encountered causing failures and preventing the job from making progress.

◈ Output destination such as SQL or Event Hubs are not scaled properly and are throttling write operations.

Stream Analytics provides a large set of metrics that can be used to detect such conditions as input events per second, output events per second, late events per second, number of runtime errors, and more. The list of existing metrics and instructions on how to use them can be found on our monitoring documentation.

Because some streaming jobs may have complex and unpredictable patterns of incoming data and the output they produce, it can be difficult to monitor such jobs using conventional metrics like input and output events per second. For example, the job may be receiving data only during specific times in the day and only produce an output when some rare condition occurs.

For this reason, we introduced a new metric called output watermark delay. This metric is aimed towards providing a reliable signal of job health which is agnostic to input and output patterns of the job.

So, how does output watermark delay work?


Modern stream processing systems differentiate between event time also referred to as application time, and arrival time.

Event time is the time generated by the producer of the event and typically contained in the event data as one of the columns. Arrival time is the time when the event was received by the event ingestion layer, for example, when the event reaches Event Hubs.

Most applications prefer to use event time as it excludes possible delays associated with transferring and processing of events. In-Stream Analytics, you can use the timestamp by clause to specify what value should be used as event time.

The watermark represents a specific timestamp in the event time timeline. This timestamp is used as a pointer or indicator of progress in the temporal computations. For example, when Stream Analytics reports a certain watermark value at the output, it guarantees that all events prior to this timestamp were already computed. Watermark can be used as an indicator of liveliness for the data produced by the job. If the delay between the current time and watermark is small, it means the job is keeping up with the incoming data and produces results defined by the query on time.

Below we show an illustration of this concept using a simple example of a passthrough query:

Azure Tutorial and Material, Azure Study Materials, Azure Guides, Azure Certification

Stream Analytics conveniently displays this metric, shown as watermark delay in the metrics view of the job in Azure Portal. This value represents the maximum watermark delay across all partitions of all outputs in the job.

Azure Tutorial and Material, Azure Study Materials, Azure Guides, Azure Certification

It is highly recommended to set up automated alerts to detect when the watermark delay exceeds expected value. It is recommended to pick threshold value to be greater than late arrival tolerance specified in event ordering settings of the job.

The following screenshot demonstrates the alert configuration in the Azure Portal. You can also use PowerShell or REST APIs to configure alerts programmatically.

Azure Tutorial and Material, Azure Study Materials, Azure Guides, Azure Certification

Saturday 13 October 2018

Data models within Azure Analysis Services and Power BI

In a world where self-service and speed of delivery are key priorities in any reporting BI solution, the importance of creating a comprehensive and performant data semantic model layer is sometimes overlooked.

I have seen quite a few occurrences where the relational data store such as Azure SQL Database and Azure SQL Data Warehouse are well structured, the reporting tier is well presented whether that is SQL Server reporting services or Power BI, but still, the performance is not as expected.

Before we drill down to the data semantic model, I always advise that understanding your data and how you want to present and report on it is key. By creating a report that takes the end consumer through a data journey is the difference between a good and a bad report. Report designing should take into account who is consuming and what they want to achieve out of the report. For example, if you have a small number of consumers who need to view a lower level of hierarchical data with additional measures or KPIs, then it may not be suitable to visualize this on the first page. As the majority of consumers may want to view a more aggregated view of the data. This example could lead to the first page of the report taking longer to return the data, thus giving a perception of a slow running report to the majority of consumers. To achieve a better experience, we could take the consumers through a data journey to ensure that the detail level does not impact the higher-level data points.

Setting the correct service level agreements and performance expectation is key. Setting an SLA for less than two seconds may be achievable if the data is two million rows. But would this still be met if it was two billion rows? There are many factors in understanding what is achievable, and the data set size is one of them. Network, compute, architecture patterns, data hierarchies, measures, KPIs, consumer device, consumer location, and real-time vs batch reporting are other impacts that can affect the perception of performance to the end consumer.

However, creating and/or optimizing your data semantic model layer will have a drastic impact on the overall performance.

The basics


The question I sometimes get is, with more computing power and the use of Azure, why can I not just report directly from my data lake or operational SQL Server? The answer is that reporting from data is very different from writing and reading data in an online transaction processing (OLTP) approach.

Dimensional modeling developed by Kimball has now been a data warehouse proven methodology and widely used for the last 20 plus years. The ideology behind the dimensional modeling is to be able to generate interactive reporting where consumers can retrieve calculations, aggregate data, and show business KPIs.

Due to creating dimensional models within a star or snowflake schema, you have the ability to retrieve the data in a more performant way due to the schema being designed for retrieval and reads rather than reads and writes, which are commonly associated with an OLTP database design.

In a star or snowflake schema, you have a fact table and many dimension tables. The fact table contains the foreign keys relating them to the dimension tables along with metrics and KPIs. The dimension tables contain the attributes associated with that particular dimension table. An example of this could be a date dimension table that contains month, day, and year as the attributes.

Creating dimensional modeling for data warehousing such as SQL Server or Azure SQL Data Warehouse will assist in what you are trying to achieve out of a reporting solution. Again, traditional warehouses have been deployed widely over the last 20 years. Even with this approach, creating a data semantic model on top of the warehouse can improve performance as well as things like improving concurrency and even adding an additional layer of security between the end consumers and the source warehouse data. SQL Server Analysis Services and now Azure Analysis Services have been designed for this purpose. We can essentially serve the required data from the warehouse into a model that can then be consumed as below.

Azure Analysis Services, Power BI, Azure Learning, Azure Tutorial and Material

Traditionally, the architecture was exactly that. Ingest data from the warehouse into the cube sitting on an instance of Analysis Services, process the cube, and then serve to SQL Server Reporting Services, Excel, and more. The landscape of data ingestion has changed over the last five to ten years with the adoption of big data and the end consumers wanting to consume a wider range of data sources, whether that is SQL, Spark, CSV, JSON, or others.

Modern BI reporting now needs to ingest, mash, clean and then present this data. Therefore, the data semantic layer needs to be agile but also delivering on performance. However, the principles of designing a model that aligns to dimensional modeling are still key.

In a world of data services in Azure, Analysis Services and Power BI are good candidates for building data semantic models on top of a data warehousing dimensional modeling. The fundamental principles of these services have formed the foundations for Microsoft BI solutions historically, even though they have evolved and now use modern in-memory architecture and allow agility for self-service.

Power BI and Analysis Services Tabular Model


SQL Server Analysis Services Tabular model, Azure Analysis Services, and Power BI share the same underlining fundamentals and principles. They are all built using the tabular model which was first released on SQL Server in 2012.

SQL Server Analysis Services Multi Dimension is a different architecture and is set at the server configuration section at the install point.

The Analysis Service Tabular model (in Power BI) is built on the columnar in-memory architecture, which forms the VertiPaq engine.

Azure Analysis Services, Power BI, Azure Learning, Azure Tutorial and Material

At processing time, the rows of data are converted into columns, encoded, and compressed allowing more data to be stored. Due to the data being stored in memory the analytical reporting delivers high performance, versus retrieving data from disk-based systems. The purpose of in-memory tabular models is to minimize read times for reporting purposes. Again, understanding the consumer reporting behavior is key, tabular models are designed to retrieve a small number of columns. The balance here is that when you retrieve a high number of columns, the engine needs to sort back into rows of data and decompress, which impacts compute.

Best practices for data modeling


The best practices below are some of the key observations I have seen over the last several years, particularly when creating data semantic models in SQL Server Analysis Services, Azure Analysis Services, or Power BI.

◈ Create a dimension model star and/or snowflake, even if you are ingesting data from different sources.

◈ Ensure that you create integer surrogate keys on dimension tables. Natural keys are not best practice and can cause issues if you need to change them at a later date. Natural keys are generally strings, so larger in size and can perform poorly when joining to other tables. The key point in regards to performance with tabular models is that natural keys are not optimal for compression. The process with natural keys is that they are:

    ◈ Encoded, hash/dictionary encoding.

    ◈ Foreign keys encoded on the fact table relating to the dimension table, again hash/dictionary encoding.

    ◈ Build the relationships.

◈ This has an impact on performance and reduces the available memory for data as a proportion, which will be needed for the dictionary encoding.

◈ Only bring into the model the integer surrogate keys or value encoding and exclude any natural keys from the dimension tables.

◈ Only bring into the model the foreign keys or integer surrogate keys on the fact table from the dimension tables.

◈ Only bring columns into your model that are required for analysis, this may be excluding columns that are not needed or filter on data to only bring the data in that is being analyzed.

◈ Reduce cardinality so that the values uniqueness can be reduced, allowing for much greater compression.

◈ Add a date dimension into your model.

◈ Ideally, we should run calculations at the compute layer if possible.

The best practices noted above have all been used in part or collectively to improve the performance for the consumer experience. Once the data semantic models have been created to align with best practices, then performance expectations can be gauged and aligned with SLA’s. The key focus on the best practices above is to ensure that we utilize the VertiPaq in-memory architecture. A large part of this is to ensure that data can be compressed as much as possible so that we can store more data within the model but also so that we can report upon the data in an efficient way.

Thursday 11 October 2018

Azure Redis Cache feature updates

We are pleased to announce that firewall and reboot functions are now supported in all three Azure Redis Cache tiers. We have been making these previously premium-only features available to the basic and standard tiers at no additional cost. In addition, we are previewing the ability to pin your Redis instance to specific Availability Zone-enabled Azure regions.

Firewall


Firewall provides added security for your Azure Redis deployment. It lets you restrict which clients can connect to your Redis cache based on their IP addresses. You can create a firewall rule for each IP address range that your Redis clients use. Once you enable firewall, by specifying at least one rule only those requests coming from IP addresses that fall into the defined IP range(s) will be accepted by Redis. Redis monitoring endpoints are excluded from firewall rules, however. This prevents accidental network disconnect due to firewall settings and ensures that monitoring will work uninterrupted.

Azure Certification, Azure Guides, Azure Learning, Azure Tutorial and Material

Reboot


Reboot allows you to restart one or more nodes in your Redis Cache. This function is useful particularly for simulating cache failures and testing how your application would react to them. It is a highly requested feature from User Voice. You can reboot any cache node using the Reboot blade in the Azure Portal or this PowerShell command. Please keep in mind that you may lose data due to a reboot and the amount of loss depends on which node(s) you are rebooting.
Azure Certification, Azure Guides, Azure Learning, Azure Tutorial and Material

Zonal Pinning


Zonal pinning gives you the ability to control where your cache instance is placed within an Azure region that is consisted of multiple Availability Zones, which protect you from datacenter-level failures. By pinning your cache to a specific zone, you can make sure that your application and cache are located closely together. This feature is currently in public preview (as are Availability Zones) and is supported on Premium Redis caches. You can try out zonal pinning by following this set of instructions after you have enabled your Azure subscription for zone support.

Azure Certification, Azure Guides, Azure Learning, Azure Tutorial and Material

Wednesday 10 October 2018

Improved governance experience with Ethereum Proof-of-Authority 1.2

Since launching Ethereum Proof-of-Authority we've received great feedback and have learned more about the ways our customers have leveraged this solution to roll out their Blockchain applications. We’ve rolled out a number of features that improve user-experience, configuration, and deployment reliability.

Governance DApp


This update comes with a new governance experience that makes consortium management more intuitive.

The Governance DApp is used for admin management and validator delegation. Each admin can select a set of validators which will propose blocks within PoA consensus. Admins also have the power to vote either to add or remove other admins. This form of on-chain governance helps decentralize the power of network operation and provides a familiar mechanism to maintaining a healthy network over time.

Azure Tutorials and Material, Azure Learning, Azure Certification, Azure Guides

Azure Tutorials and Material, Azure Learning, Azure Certification, Azure Guides

Please note, that this new UI will not be compatible with previously deployed networks of Proof-of-Authority (PoA).

WebSocket support


We’ve added WebSocket support to make it easy to subscribe to events directly or connect to external tools and applications such as BlockScout, an open-source block explorer. You can locate the WebSocket endpoint as part of the deployment output or post-deployment email.

Azure Tutorials and Material, Azure Learning, Azure Certification, Azure Guides

BlockScout block explorer


We have also put together a new deployment guide with instructions on how to setup BlockScout with a new Proof-of-Authority deployment. BlockScout allows you to have a transparent view into the blockchain. You can easily search by the transaction, user address, contact address, and block number.

Azure Tutorials and Material, Azure Learning, Azure Certification, Azure Guides

Just-In-Time (JIT) VM Access and Azure Backup Support


With production readiness in mind, we’ve enabled support for JIT VM access and Azure Backup Support. JIT VM Access allows you to reduce the potential for attacks by tightly controlling how members within your organization procure access to the VM. Azure Backup provides the ability to create scheduled backups of your VM hard drives. This presents an easy way to handle disaster recovery and prevent loss of critical on-chain data.

VM SKU selection


We’ve performed extensive performance testing on the network and have tuned the VM selection to provide clearer options and documentation, to make it more intuitive when selecting the right VM SKU.

More configuration options


Before deployment, you can now specify the starting block gas limit and block reseal time. Block gas limit will influence the size of each block, while the block reseals time will control how frequently blocks are generated in the case of empty transactions. A high block reseals time will decrease the disk consumption rate but will affect block finality in networks that have sparse transaction throughput.

Azure Tutorials and Material, Azure Learning, Azure Certification, Azure Guides

Improved reliability


The ARM template will perform additional validation after each deployment to ensure that the network has started up correctly. Additionally, Azure Monitor deployment reliability has been improved by deploying the Azure Monitor components in series.

Tuesday 9 October 2018

A fast, serverless, big data pipeline powered by a single Azure Function

A single Azure function is all it took to fully implement an end-to-end, real-time, mission critical data pipeline. And it was done with a serverless architecture. Serverless architectures simplify the building, deployment, and management of cloud scale applications. Instead of worrying about data infrastructure like server procurement, configuration, and management a data engineer can focus on the tasks it takes to ensure an end-to-end and highly functioning data pipeline.

This blog describes an Azure function and how it efficiently coordinated a data ingestion pipeline that processed over eight million transactions per day.

Scenario


A large bank wanted to build a solution to detect fraudulent transactions submitted through mobile phone banking applications. The solution requires a big data pipeline approach. High volumes of real-time data are ingested into a cloud service, where a series of data transformation and extraction activities occur. This results in the creation of a feature data set, and the use of advanced analytics. For the bank, the pipeline had to be very fast and scalable, end-to-end evaluation of each transaction had to complete in less than two seconds.

Telemetry from the bank’s multiple application gateways, stream in as embedded events in complex JSON files. The ingestion technology is Azure Event Hubs. Each event is ingested into an Event Hub and parsed into multiple individual transactions. Attributes are extracted from each transaction and evaluated for fraud. The serverless architecture is constructed from these Azure services:

◈ Azure Event Hubs
◈ Azure Functions
◈ Azure Machine Learning Studio
◈ Azure SQL Database
◈ CosmosDB

Pipeline architecture


A single Azure Function was used to orchestrate and manage the entire pipeline of activities. The following diagram highlights the Azure Functions pipeline architecture:

◈ An enterprise system bus sends bank transaction in a JSON file that arrives into an Event Hub. The arrival triggers a response to validate and parse the ingested file.

◈ A SQL stored procedure is invoked. The procedure extracts data elements from the JSON message and aggregates them with customer and account profiles to generate a feature set, which is the input for a machine learning model. The aggregated message is formatted as a JSON file.

◈ The validated JSON message is written to Cosmos DB.

◈ A machine learning model is invoked to evaluate and score the transaction.

◈ The fraud score is posted back to an on-premises API for integration to a case management solution.

Azure Tutorial and Material, Azure Certification, Azure Study Material

Figure 1: Azure Function pipeline architecture 

Pipeline in ten steps


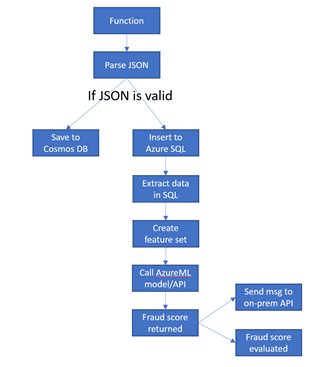
The Azure Function is written in C# and is composed of ten methods that are charted out in the diagram that follows.  The methods include:

1. A method is triggered when an event is received by an Event Hub.

public static void Run(string myEventHubMessage, ICollector<string> resultsCollection, TraceWriter log)

2. The message is processed, and the JSON is validated.

private static void ProcessInitialMessageFromEventHub(List<string> jsonResults, string cnnString, TelemetryClient appInsights, dynamic d)

3. Invoke code to execute a SQL command to insert  the message event.

private static bool CheckRequestTypeForValidMessage(dynamic d)

4. If the JSON message is valid, save it to Cosmos DB for purposes of querying later.

private static void SaveDocDb(string json, TraceWriter log)

5. Once the JSON is parsed, extract the relevant attributes.

private static string ProcessSQLReturnedFeaturesForAML(TraceWriter log, List<string>, jsonResults, TelemetryClient appInsights)

6. Execute a stored procedure to create the features that will be the input to the machine learning model.

private static string SendDataToStoredProc(dynamic d, SqlCommand spCommand, dynamic t, TelemetryClient appInsights, TransactionType transactionTypeEnum = TransactionType.Other, dynamic responseData = null)

7. Invoke a call to the Azure ML services endpoint. Obtain a score from Azure ML. Pass in the input parameters.

private static string CallAzureMl(dynamic d, TraceWriter log, HttpClient client)

8. The ML service returns a score which is then processed.

public static List<string> GetScoresFromAzureMl(string myEventHubMessage, TraceWriter log, TelemetryClient appInsights, HttpClient client)

9. Make a call to the on-premises system, passing the message as an argument.

public static List<string> ProcessMessagesIntoEsb(TraceWriter log, string cnnString, TelemetryClient appInsights, string cardNumber, string accountNumber, List<string>esbReturnMessages)

10. The score is evaluated against a threshold, which determines if it should be passed on to the on-premises case management system.

public static string CheckScoreAndProcessEsbMessages(string> myEventHubMessage, TraceWriter log, SqlCommand spCommand, TelemetryClient appInsights, string cardNumber, string accountNumber)

The  figure below shows the logic as a vertical set of ten blocks, one for each task in the code.

Azure Tutorial and Material, Azure Certification, Azure Study Material

Figure 2: Azure Function pipeline flow 

Pipeline scalability


The pipeline must be responsive to extreme bursts of incoming JSON files. It must parse each file into individual transactions, and process and evaluate each transaction for fraud. After experimenting with different configuration parameters, there were some settings that were helpful to ensure the Azure function could scale as needed and process the volume of messages and transactions within the required time constraints: 

◈ Azure Autoscale is a capability built into cloud services like Azure Functions. It is rules-based and provides the ability to scale a service like Azure Functions up or down based on defined thresholds. By default, because of the volume of data ingested into Event Hubs, the Azure Functions service scaled too quickly, and created too many instances of itself. That resulted in locking issues on the Event Hub partitions, impacting throughput significantly. After experimentation with autoscale feature, the setting for the Functions service was set to a minimum of one and a maximum of four instances.

◈ Two Event Hubs settings were important for ensuring performance and throughput for the Azure function:
maxBatchSize: Gets or sets the maximum event count that a user is willing to accept for processing per receive loop. This count is on a per-Event Hub partition level.
prefetchCount: Gets or sets the number of events that any receiver in the currently owned partition will actively cache. The default value for this property is 300.

After experimenting with different settings, the optimal configuration for this solution turned out to be:

// Configuration settings for 'eventHub' triggers. (Optional)
   "eventHub": {
    // The maximum event count received per receive loop. The default is 64.
    "maxBatchSize": 10,
    // The default PrefetchCount that will be used by the underlying EventProcessorHost.
    "prefetchCount": 40,
    // The number of event batches to process before creating an EventHub cursor   checkpoint.
    "batchCheckpointFrequency": 1
   },