Thursday, 30 July 2020

Monitoring Azure Arc enabled Kubernetes and servers

Azure Arc is a preview service that enables users to create and attach Kubernetes clusters both inside and outside of Azure. Azure Arc also enables the user to manage Windows and Linux machines outside of Azure the same way native Azure Virtual Machines are managed. To monitor these Azure Arc enabled clusters and servers, you can use Azure Monitor the same way you would use it for the Azure resources.

With Azure Arc, the Kubernetes clusters and servers are given a full-fledged Azure Resource ID and managed identity, enabling various scenarios that simplifies management and monitoring of these resources from a common control plane. For Kubernetes, this enables scenarios such as deploying applications through GitOps-based management, applying Azure policy, or monitoring your containers. For servers, users also benefit from applying Azure policies and collecting logs with Log Analytics agent for virtual machine (VM) monitoring.

Monitoring Azure and on-premises resources with Azure Monitor


As customers begin their transition to the cloud, monitoring on-premises resources alongside their cloud infrastructure can feel disjointed and cumbersome to manage. With Azure Arc enabled Kubernetes and Servers, Azure Monitor can enable you to monitor your full telemetry across your cloud-native and on-premises resources in a single place. This saves the hassle of having to configure and manage multiple different monitoring services and bridges the disconnect that many people experience when working across multiple environments.

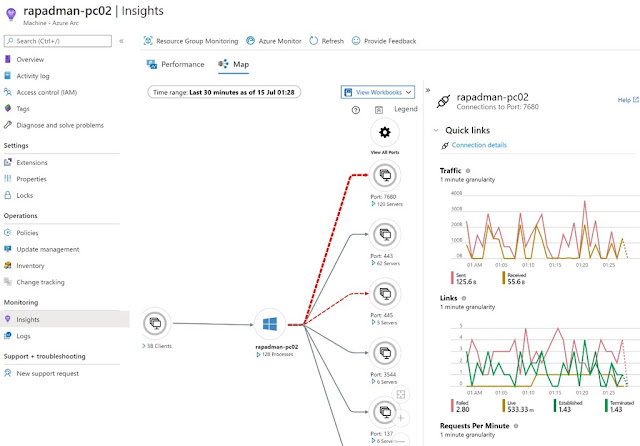
For example, the below view shows the Map experience of Azure Monitor on an Azure Arc enabled server, with the dashed red lines showing failed connections. The graphs on the right side of the map show detailed metrics about the selected connection.

Azure Kubernetes, Azure Study Materials, Azure Exam Prep, Azure Exam Prep

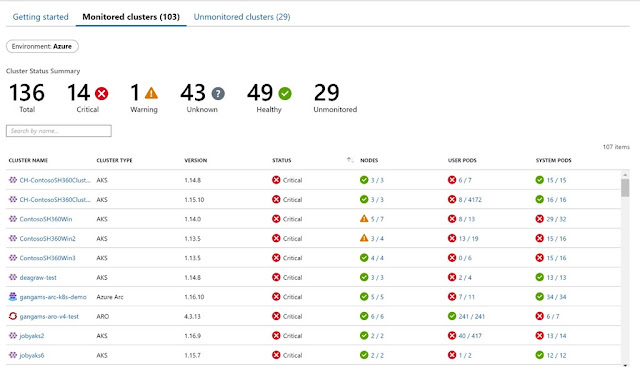
Also, here you can see your data from Azure Kubernetes Services (AKS), Azure Arc, and Azure Red Hat OpenShift side-by-side in Azure Monitor for containers:

Azure Kubernetes, Azure Study Materials, Azure Exam Prep, Azure Exam Prep

Using Azure Monitor for Azure Arc enabled servers


Azure Monitor for VMs is a complete monitoring offering that gives you views and information about the performance of your virtual machines, as well as dependencies your monitored machines may have. It provides an insights view of a single monitored machine, as well as an at-scale view to look at the performance of multiple machines at once.

Azure Arc enabled servers fit right into the existing monitoring view for Azure Virtual Machines, so the monitoring view on an Azure Arc enabled server will look the same as the view of a native Azure Virtual Machines. From within the Azure Arc blade, you can look at your Azure Arc machines and dive into their monitoring, both through the Performance tab, which shows insights about different metrics such as CPU Utilization and the Map tab, which shows dependencies.

Azure Kubernetes, Azure Study Materials, Azure Exam Prep, Azure Exam Prep

In the at-scale monitoring view, your Azure Arc machines are co-mingled with your native Azure Virtual Machines and Virtual Machines Scale Sets to create a single place to view performance information about your machines. The monitoring data shown in these at-scale views will include all VMs, Virtual Machines Scale Sets, and Azure Arc enabled servers that you have onboarded to Azure Monitor.

The Getting Started tab provides an overview of the monitoring status of your machines, broken down by subscription and resource group.

Azure Kubernetes, Azure Study Materials, Azure Exam Prep, Azure Exam Prep

The Performance tab shows trends at scale, as the performance in certain metrics of all the machines in the chosen subscription and resource group. Within the at-scale view, with the provided Type filter, you can drill down any view to show either your native Azure Virtual Machines, native Azure Virtual Machine Scale Sets, or your Azure Arc enabled servers.

Azure Kubernetes, Azure Study Materials, Azure Exam Prep, Azure Exam Prep

Using Azure Monitor for Azure Arc enabled Kubernetes


Azure Monitor for Containers provides numerous monitoring features to create a thorough experience to understand the health and performance for your Azure Arc clusters.

Azure Monitor provides both an at-scale view for all your clusters, ranging from standard AKS, AKS-engine, Azure Red Hat OpenShift, and Azure Arc. Azure Monitor provides important details, such as:

◉ Health statuses (healthy, critical, warning, unknown).
◉ Node count.
◉ Pod count (user and system).

At the resource level for your Azure Arc enabled Kubernetes, there are several key performance indicators for your cluster. Users can toggle the metrics for these charts based on percentile and pin them to their Azure Dashboards.

Azure Kubernetes, Azure Study Materials, Azure Exam Prep, Azure Exam Prep

In the Nodes, Controllers, and Containers tab, data is displayed across various levels of hierarchy with detailed information in the context blade. By clicking on the View in Analytics, you can take a deep dive into the full container logs to analyze and troubleshoot.

Azure Kubernetes, Azure Study Materials, Azure Exam Prep, Azure Exam Prep

Tuesday, 28 July 2020

Advancing resilience through chaos engineering and fault injection

Developing large-scale, distributed applications has never been easier, but there is a catch. Yes, infrastructure is provided in minutes thanks to your public cloud, there are many language options to choose from, swaths of open source code available to leverage, and abundant components and services in the marketplace to build upon. Yes, there are good reference guides that help give a leg up on your solution architecture and design, such as the Azure Well-Architected Framework and other resources in the Azure Architecture Center. But while application development is easier, there’s also an increased risk of impact from dependency disruptions. However rare, outages beyond your control could occur at any time, your dependencies could have incidents, or your key services/systems could become slow to respond. Minor disruptions in one area can be magnified or have longstanding side effects in another. These service disruptions can rob developer productivity, negatively affect customer trust, cause lost business, and even impact an organization’s bottom line.

Modern applications, and the cloud platforms upon which they are built, need to be designed and continuously validated for failure. Developers need to account for known and unknown failure conditions, applications and services must be architected for redundancy, algorithms need retry and back-off mechanisms. Systems need to be resilient to the scenarios and conditions caused by infrequent but inevitable production outages and disruptions. This post is designed to get you thinking about how best to validate typical failure conditions, including examples of how we at Microsoft validate our own systems.

Resilience


Resilience is the ability of a system to fail gracefully in the face of—and eventually recover from—disruptive events. Validating that an application, service, or platform is resilient is equally as important as building for failure. It is easy and tempting to validate the reliability of individual components in isolation and infer that the entire system will be just as reliable, but that could be a mistake. Resilience is a property of an entire system, not just its components. To understand if a system is truly resilient, it is best to measure and understand the resilience of the entire system in the environment where it will run. But how do you do this, and where do you start?

Chaos engineering and fault injection


Chaos engineering is the practice of subjecting a system to the real-world failures and dependency disruptions it will face in production. Fault injection is the deliberate introduction of failure into a system in order to validate its robustness and error handling.

Through the use of fault injection and the application of chaos engineering practices generally, architects can build confidence in their designs – and developers can measure, understand, and improve the resilience of their applications. Similarly, Site Reliability Engineers (SREs) and in fact anyone who holds their wider teams accountable in this space can ensure that their service level objectives are within target, and monitor system health in production. Likewise, operations teams can validate new hardware and datacenters before rolling out for customer use. Incorporation of chaos techniques in release validation gives everyone, including management, confidence in the systems that their organization is building.

Throughout the development process, as you are hopefully doing already, test early and test often. As you prepare to take your application or service to production, follow normal testing practices by adding and running unit, functional, stress, and integration tests. Where it makes sense, add test coverage for failure cases, and use fault injection to confirm error handling and algorithm behavior. For even greater impact, and this is where chaos engineering really comes into play, augment end-to-end workloads (such as stress tests, performance benchmarks, or a synthetic workload) with fault injection. Start in a pre-production test environment before performing experiments in production, and understand how your solution behaves in a safe environment with a synthetic workload before introducing potential impact to real customer traffic.

Healthy use of fault injection in a validation process might include one or more of the following:

◉ Ad hoc validation of new features in a test environment:

A developer could stand up a test virtual machine (VM) and run new code in isolation. While executing existing functional or stress tests, faults could be injected to block network access to a remote dependency (such as SQL Server) to prove that the new code handles the scenario correctly.

◉ Automated fault injection coverage in a CI/CD pipeline, including deployment or resiliency gates:

Existing end-to-end scenario tests (such as integration or stress tests) can be augmented with fault injection. Simply insert a new step after normal execution to continue running or run again with some faults applied. The addition of faults can find issues that would normally not be found by the tests or to accelerate discovery of issues that might be found eventually.

◉ Incident fix validation and incident regression testing:

Fault injection can be used in conjunction with a workload or manual execution to induce the same conditions that caused an incident, enabling validation of a specific incident fix or regression testing of an incident scenario.

◉ BCDR drills in a pre-production environment:

Faults that cause database failover or take storage offline can be used in BCDR drills, to validate that systems behave appropriately in the face of these faults and that data is not lost during any failover tests.

◉ Game days in production:

A ‘game day’ is a coordinated simulation of an outage or incident, to validate that systems handle the event correctly. This typically includes validation of monitoring systems as well as human processes that come into play during an incident. Teams that perform game days can leverage fault injection tooling, to orchestrate faults that represent a hypothetical scenario in a controlled manner.

Typical release pipeline


This figure shows a typical release pipeline, and opportunities to include fault injection:

Microsoft Tutorial and Materials, Microsoft Exam Prep, Microsoft Learning, Microsoft Guides

An investment in fault injection will be more successful if it is built upon a few foundational components:

◉ Coordinated deployment pipeline.
◉ Automated ARM deployments.
◉ Synthetic runners and synthetic end-to-end workloads.
◉ Monitoring, alerting, and livesite dashboards.

With these things in place, fault injection can be integrated in the deployment process with little to no additional overhead – and can be used to gate code flow on its way to production.

Localized rack power outages and equipment failures have been found as single points of failure in root cause analysis of past incidents. Learning that a service is impacted by, and not resilient to, one of these events in production is a timebound, painful, and expensive process for an on-call engineer. There are several opportunities to use fault injection to validate resilience to these failures throughout the release pipeline in a controlled environment and timeframe, which also gives more opportunity for the code author to lead an investigation of issues uncovered. A developer who has code changes or new code can create a test environment, deploy the code, and perform ad hoc experiments using functional tests and tools with faults that simulate taking dependencies offline – such as killing VMs, blocking access to services, or simply altering permissions. In a staging environment, injection of similar faults can be added to automated end-to-end and integration tests or other synthetic workloads. Test results and telemetry can then be used to determine impact of the faults and compared against baseline performance to block code flow if necessary.

In a pre-production or ‘Canary’ environment, automated runners can be used with faults that again block access to dependencies or take them offline. Monitoring, alerting, and livesite dashboards can then be used to validate that the outages were observed as well as that the system reacted and compensated for the issue—that it demonstrated resilience. In this same environment, SREs or operations teams may also perform business continuity/disaster recovery (BCDR) drills, using fault injection to take storage or databases offline and once again monitoring system metrics to validate resilience and data integrity. These same Canary activities can also be performed in production where there is real customer traffic, but doing so incurs a higher possibility of impact to customers so it is recommended only to do this after leveraging fault injection earlier in the pipeline. Establishing these practices and incorporating fault injection into a deployment pipeline allows systematic and controlled resilience validation which enables teams to mitigate issues, and improve application reliability, without impacting end customers.

Fault injection at Microsoft


At Microsoft, some teams incorporate fault injection early in their validation pipeline and automated test passes. Different teams run stress tests, performance benchmarks, or synthetic workloads in their automated validation gates as normal and a baseline is established. Then the workload is run again, this time with faults applied – such as CPU pressure, disk IO jitter, or network latency. Workload results are monitored, telemetry is scanned, crash dumps are checked, and Service Level Indicators (SLIs) are compared with Service Level Objectives (SLOs) to gauge the impact. If results are deemed a failure, code may not flow to the next stage in the pipeline.

Other Microsoft teams use fault injection in regular Business Continuity, Disaster Recovery (BCDR) drills, and Game Days. Some teams have monthly, quarterly, or half-yearly BCDR drills and use fault injection to induce a disaster and validate both the recovery process as well as the alerting, monitoring and live site processes. This is often done in a pre-production Canary environment before being used in production itself with real customer traffic. Some teams also carry out Game Days, where they come up with a hypothetical scenario, such as replication of a past incident, and use fault injection to help orchestrate it. Faults, in this case, might be more destructive—such as crashing VMs, turning off network access, causing database failover, or simulating an entire datacenter going offline. Again, normal live site monitoring and alerting are used, so your DevOps and incident management processes are also validated. To be kind to all involved, these activities are typically performed during business hours and not overnight or over a weekend.

Our operations teams also use fault injection to validate new hardware before it is deployed for customer use. Drills are performed where the power is shut off to a rack or datacenter, so the monitoring and backup systems can be observed to ensure they behave as expected.

At Microsoft, we use chaos engineering principles and fault injection techniques to increase resilience, and confidence, in the products we ship. They are used to validate the applications we deliver to customers, and the services we make available to developers. They are used to validate the underlying Azure platform itself, to test new hardware before it is deployed. Separately and together, these contribute to the overall reliability of the Azure platform—and improved quality in our services all up.

Unintended consequences


Remember, fault injection is a powerful tool and should be used with caution. Safeguards should be in place to ensure that faults introduced in a test or pre-production environment will not also affect production. The blast radius of a fault scenario should be contained to minimize impact to other components and to end customers. The ability to inject faults should have restricted access, to prevent accidents and prevent potential use by hackers with malicious intent. Fault injection can be used in production, but plan carefully, test first in pre-production, limit the blast radius, and have a failsafe to ensure that an experiment can be ended abruptly if needed. The 1986 Chernobyl nuclear accident is a sobering example of a fault injection drill gone wrong. Be careful to insulate your system from unintended consequences.

Chaos as a service?


This is an exciting space with so much potential to improve cloud service reliability and reduce the impact of rare but inevitable disruptions. There are many teams doing lots of interesting things in this space, and we’re exploring how best to bring all these disparate tools and faults together to make our lives easier—for our internal developers building Azure services, for built-on-Azure services like Microsoft 365, Microsoft Teams, and Dynamics, and eventually for our customers and partners to use the same tooling to wreak havoc on (and ultimately improve the resilience of) their own applications and solutions.

Source: microsoft.com
Saturday, 25 July 2020

Azure Data Factory Managed Virtual Network

Azure Data Factory is a fully managed, easy-to-use, serverless data integration, and transformation solution to ingest and transform all your data. Choose from over 90 connectors to ingest data and build code-free or code-centric ETL/ELT processes.

Security is a key tenet of Azure Data Factory. Customers want to protect their data sources and hope that data transmission occurs as much as possible in a secure network environment. Any potential man-in-the-middle or spoof traffic attack on public networks could bring problems of data security and data exfiltration.

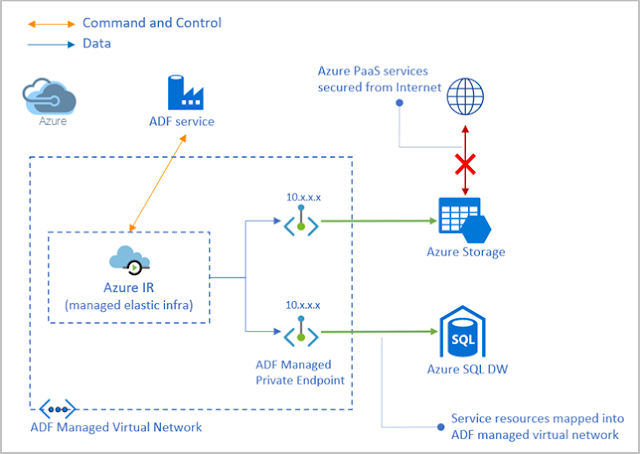
Now we are glad to announce the preview of Azure Data Factory Managed Virtual Network. This feature provides you with a more secure and manageable data integration solution. With this new feature, you can provision the Azure Integration Runtime in Managed Virtual Network and leverage Private Endpoints to securely connect to supported data stores. Your data traffic between Azure Data Factory Managed Virtual Network and data stores goes through Azure Private Link which provides secured connectivity and eliminates your data exposure to the internet. With the Managed Virtual Network along with Private Endpoints, you can also offload the burden of managing virtual network to Azure Data Factory and protect against the data exfiltration.

High-level architecture


Azure Data, Azure Study Materials, Azure Certification, Azure Exam Prep, Azure Learning

Azure Data Factory Managed Virtual Network terminology


Managed Virtual Network

The Managed Virtual Network is associated with Azure Data Factory instance and managed by Azure Data Factory. When you provision Azure Integration Runtime, you can choose to have the Azure Integration Runtime within Managed Virtual Network.

Creating an Azure Integration Runtime within managed Virtual Network ensures that data integration process is completely isolated and secure.

Azure Data, Azure Study Materials, Azure Certification, Azure Exam Prep, Azure Learning

Managed Private Endpoints

Managed Private Endpoints are private endpoints created in the Azure Data Factory Managed Virtual Network establishing a private link to Azure resources. Azure Data Factory manages these private endpoints on your behalf.

Private endpoint uses a private IP address in the managed virtual network to effectively bring the service into it. Private endpoints are mapped to a specific resource in Azure and not the entire service. Customers can limit connectivity to a specific resource approved by their organization.

Azure Data, Azure Study Materials, Azure Certification, Azure Exam Prep, Azure Learning

Thursday, 23 July 2020

Protecting Windows Virtual Desktop environments with Azure Security Center

With massive workforces now remote, IT admins and security professionals are under increased pressure to keep everyone productive and connected while combatting evolving threats.

Windows Virtual Desktop is a comprehensive desktop and application virtualization service running in Azure, delivering simplified management for virtual desktop infrastructure (VDI).

While organizations go through this transformation, allowing their employees to remain productive, IT and security professionals required to ensure the deployment of Windows Virtual Desktop is done in accordance with security best practices so it doesn’t add unnecessary risk to the business. In this blog, we will explore how Azure Security Center can help maintain your Windows Virtual Desktop environment configuration hygiene and compliance, and protect it against threats.

Overview of Windows Virtual Desktop Host Pool architecture


When setting up your Windows Virtual Desktop environment, you first need to create a Host Pool which is a collection of one or more identical virtual machines (VMs). To support the remote workforce use case, these VMs will usually run a Windows 10 multi-session OS. Below is an overview of the architecture:

Azure Security, Azure Tutorial and Material, Azure Exam Prep, Azure Certification

You can find the VMs running in your host pool by checking the Host Pool details and clicking on the Resource Group name:

Azure Security, Azure Tutorial and Material, Azure Exam Prep, Azure Certification

This will bring up the resource group details. Filtering by Virtual Machine will show the list of VMs:

Azure Security, Azure Tutorial and Material, Azure Exam Prep, Azure Certification

Securing Windows Virtual Desktop deployment with Azure Security Center


Considering the shared responsibility model, here are the security needs customers are responsible for in Windows Virtual Desktop deployment:

◉ Network.
◉ Deployment Configuration.
◉ Session host OS.
◉ Application security.
◉ Identity.

These needs should be examined both in the context of security posture as well as threat protection. Here is an example:

◉ Misconfiguration of the VMs Network layer can increase the attack surface and result in a compromised endpoint. One thing we want to ensure is that all management ports should be closed on your Windows Virtual Desktop virtual machines.

◉ Once your users are connected to their Windows Virtual Desktop session, they might be manipulated to browse to a malicious site or connect to a malicious machine. This can also happen in case there is malware on the machine. Analyzing the network traffic to detect that your machine has communicated with what is possibly a Command and Control center is another protection layer.

Azure Security Center the following security posture management and threat protection capabilities for Windows Virtual Desktop VMs:

◉ Secure configuration assessment and Secure Score.
◉ Industry-tested vulnerability assessment.
◉ Host level detections.
◉ Agentless cloud network micro-segmentation & detection.
◉ File integrity monitoring.
◉ Just in time VM access.
◉ Adaptive Application Controls.

Here is a table that maps Azure Security Center protection capabilities Windows Virtual Desktop security needs:

Azure Security, Azure Tutorial and Material, Azure Exam Prep, Azure Certification

Switching to the Azure Security Center portal, we can see the Windows Virtual Desktop host pool VMs under Compute & apps followed by the VMs and Servers tab, as well as their respective Secure Score and status:

Azure Security, Azure Tutorial and Material, Azure Exam Prep, Azure Certification

Drilling down to a specific VM will show the full recommendation list as well as the Severity level:

Azure Security, Azure Tutorial and Material, Azure Exam Prep, Azure Certification

These VMs are also assessed for compliance with different regulatory requirements, built-in or custom ones, and any compliance issues will be flagged out under the Regulatory Compliance dashboard.

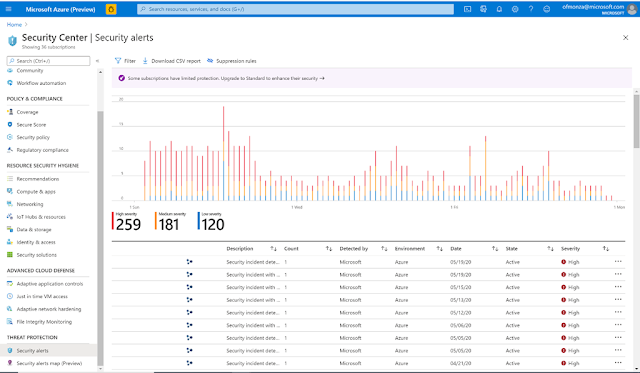
In addition, security alerts will be showing under Threat Protection followed by Security Alerts:

Azure Security, Azure Tutorial and Material, Azure Exam Prep, Azure Certification

Both security alerts and recommendations can be consumed and managed from the Security Center portal or can be exported to other tools for further analysis and remediation. One great example would be integrating Azure Security Center with Azure Sentinel as part of monitoring the Windows Virtual Desktop environment.

Enabling Azure Security Center for Windows Virtual Desktop environment


Azure Security Center Free tier provides security recommendations and Secure Score for Windows Virtual Desktop deployments.

To enable all protection capabilities you should follow these two steps:

1. Make sure you have Azure Security Center Standard tier (as shown below).
2. Enable threat protection for Virtual Machines.

Azure Security, Azure Tutorial and Material, Azure Exam Prep, Azure Certification

And one last tip. If you are using Azure Devops CI/CD Pipelines together with Windows 10 Azure VM Image as a solution for continuous build and deploy of the Windows Virtual Desktop solution, you’re most likely using Azure Key Vault for the secret management.

Tuesday, 21 July 2020

Azure Time Series Insights Gen2: Leading the next generation of industrial IoT analytics platforms

The Internet of Things (IoT) is well-established for helping businesses find real-time insights from their industrial assets opening the path towards Industry 4.0. Answering questions like “how are all of my assets performing right now?” or “how can I improve my manufacturing process and attainment?” and “when will my assets need servicing?” used to be impossible to know or required manual data collection that was always out of date.

Today, business leaders are taking advantage of IoT to see this information with the click of a button. Yet as larger volumes of data are collected from industrial assets, finding insights can become more and more difficult. It can start to require costly and time-consuming data wrangling and data analytics techniques performed by highly specialized staff.

This is where Azure Time Series Insights Gen2 comes in. This fully managed IoT analytics platform—generally available today—enables you to uncover hidden trends, spot anomalies, and conduct root-cause analysis in large volumes of industrial data with an intuitive and straightforward user experience. Simple yet powerful, Azure Time Series Insights Gen2 allows you to explore and analyze billions of contextualized events across millions of sensors.

Since Azure Times Series Insights Gen2 is a serverless offering, you don’t have to worry about managing complicated compute clusters yourself. Additionally, Azure Time Series Insights Gen2 provides a scalable, pay-as-you-go pricing model enabling you to tune your usage to your business demands.

Azure Time Series Insights Gen2 is both a web experience and a platform. Knowledge workers can use the Time Series Explorer web experience to find insights from petabytes of IoT data in seconds through the simple, intuitive user interface. Developers can use the open and scalable platform to build solutions and custom user experiences with our rich APIs and JavaScript SDKs.

Azure Tutorial and Material, Azure Study Materials, Azure Exam Prep

Azure Time Series Insights Gen2 is tailored for industrial IoT applications.

Driven by feedback from customers around the globe, here are key features that are now generally available and how they benefit industrial IoT customers.

Azure Time Series Insights Gen2 offers multi-layered storage


IoT customers work with IoT data in a variety of ways. The two most common scenarios we see are:

◉ Highly interactive analytics over a short time span.
◉ Advanced analysis of decades worth of historical data.

Azure Time Series Insights Gen2 covers both scenarios with retention-based data routing between managed warm and bring your own cold stores, including Azure Data Lake Storage. Warm store can be configured to retain up to 31 days of IoT data allowing you to perform highly interactive asset-centric analytics with low latency to monitor, trend, and troubleshoot your assets. Cold store, with its near-infinite, retention can be used to store decades worth of historical IoT data, ready to be used for operational intelligence and improved efficiencies.

Azure Tutorial and Material, Azure Study Materials, Azure Exam Prep

Multi-layered storage.

Enterprise scale to power the analytics needs of industrial customers


Azure Time Series Insights Gen2 powers the analytics needs of many industrial customers across all major segments, including manufacturing, power and utilities, oil and gas, automotive, smart buildings, and mining. These customers generate billions of events across millions of data points, with most struggling to keep pace with the vast amounts of data generated by their assets. Azure Time Series Insights Gen2 scales to accommodate high volumes of data quickly and efficiently. Alongside our scalable storage options, Azure Time Series Insights Gen2 supports one-million-time series instances (or tags) per environment with rich semantic modeling. This allows you to seamlessly explore highly contextualized data and correlate trends across your industrial assets to unlock insights and achieve operational excellence.

Azure Tutorial and Material, Azure Study Materials, Azure Exam Prep

Azure Time Series Gen2 supports one million tag instances.

Microsoft Power BI connecter helps bring your data silos together


The ability to bring your data silos together is important to make data driven decisions and drive digital transformation. Azure Time Series Insights Gen2 provides an out of the box Power BI connector which connects your Azure Time Series Insights Gen2 queries to a Power BI workspace. You can easily view your time series and business intelligence data in a single pane of glass to make better decisions with a holistic view of your business posture.

Azure Tutorial and Material, Azure Study Materials, Azure Exam Prep

Azure Time Series Gen2 integrates with Power BI.

Contextualize raw telemetry with the Time Series Model


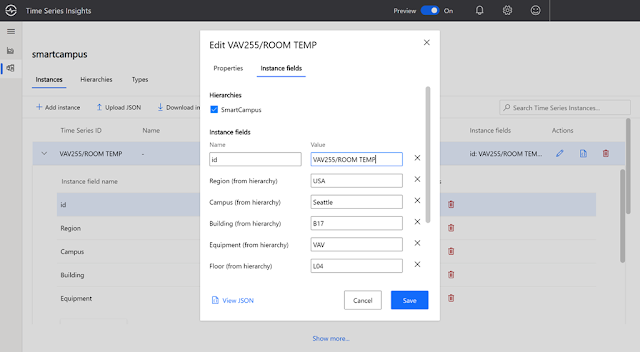
Traditionally, the data that's collected from IoT devices lacks contextual information, which makes it difficult to use for business purposes. The Time Series Model, within Azure Time Series Insights Gen2, allows you to contextualize raw telemetry by defining hierarchies, instance properties, and types. This makes your analysis of asset-centric data simple and more valuable to your organization.

It’s easy to get started with Time Series Model using Time Series Explorer to both author and curate your model. Alternatively, the Time Series Model can also be managed through our rich API surface.

Azure Tutorial and Material, Azure Study Materials, Azure Exam Prep

The Time Series Model, within Azure Time Series Insights Gen2, allows you to contextualize raw telemetry.

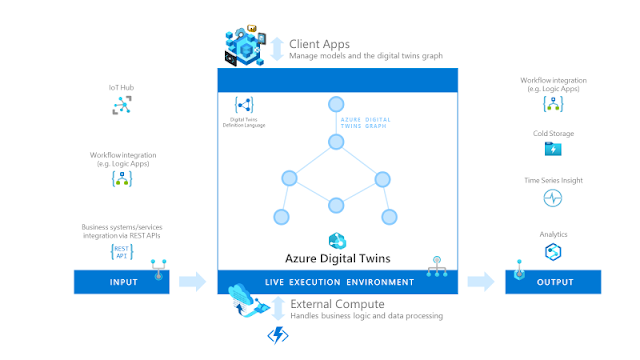
Gain insights using Azure Time Series Insights Gen2 with Azure Digital Twins


Achieve even greater insights by integrating Azure Time Series Insights Gen2 and Azure Digital Twins. Azure Digital Twins allows you to fully model your physical environment and stream live IoT data for a complete view of your connected assets and environments. Understand how your assets, customers, and processes interact in both real and simulated environments.

Azure Tutorial and Material, Azure Study Materials, Azure Exam Prep

Gain greater insights using Azure Time Series Insights Gen2 with Azure Digital Twins.

Open and flexible integration


Azure Time Series Insights Gen2 can be used with tools you know and love. Our cold store is backed by a customer-owned Azure Data Lake. Combining Azure Data Lake storage with our native support for the open source, highly efficient Apache Parquet lets you dive into decades of historical IoT data.

In addition, Azure Time Series Insights Gen2 ships with a Power BI connector allowing customers to export the time series queries they create in Azure Time Series Insights Gen2 into Power BI and view their time series data alongside other business data. Other highly sought-after connectors for popular analytics platforms such as Apache Spark™, Databricks, and Synapse will become available over time.

Time Series Explorer—analytics tool for knowledge workers and developers


The first-class user experience of the Time Series Explorer lets you use interpolation, scalar and aggregate functions, categorical variables, scatter plots, and time shifting of time series signals to analyze the data.

Time Series Explorer features the following user experience capabilities:

◔ Automatically refresh charts.

◔ Reverse lookup instance placement within the hierarchy.

◔ Select and chart multiple variables through a single operation.

◔ View chart statics.

◔ Create marker annotations.

◔ Duplicate time series instances in the well and change variables.

◔ Change the line colors through the new color picker tool.

◔ Use swim lanes to group related time series together.

New rich query APIs now give you the ability to use interpolation, new scalar and aggregate functions and categorical variables outside of the Time Series Explorer.

Time Series Explorer features the following API capabilities:

◔ Interpolate patterns from existing data to reconstruct time series signals.

◔ Process discrete signals using categorial variables.

◔ Apply trigonometric functions to identify patterns.

◔ Calculate time weighted averages.

◔ Leverage new APIs for hierarchy traversal, time series search, auto-complete, paths, and facets.

◔ Query data at scale with improved search and navigation efficiency.

◔ Leverage new conditional logic, such as IFF, which allows you to determine if an expression is true or false when selecting what data should be considered for computation. When used with categorical variables, you can create threshold monitors and map ranges of values to their categories.

Customers are using Azure Time Series Insights to gain business insights in manufacturing, power and utilities, oil and gas, automotive, smart buildings, and mining.

Fonterra empowers employees with data


Founded in 2001, Fonterra is the world’s second largest dairy processor, responsible for approximately 30 percent of global dairy exports. Owned by over 10,000 New Zealand farmers, the co-operative operates in over 100 countries and processes approximately 22 billion liters of milk each year.

In 2018, Fonterra made a decision to fast-forward their digital transformation. After a lengthy review, Microsoft was chosen to upgrade their old system with a new, cutting-edge, cloud-based platform. Renamed the “New Historian,” the updated system promises to deliver on their goal of becoming a data driven organization by giving their operators, leaders, data scientists, and business intelligence teams the power to use data more intelligently.

ENGIE Digital supports thousands of assets


ENGIE Digital, a provider of renewable energy, delivers energy and provides energy-related services to millions of consumers in more than 50 countries. ENGIE Digital designs, builds, and runs unique solutions that help other ENGIE Digital business units by supporting their development and operations. ENGIE Digital uses an in-house operational platform to collect and process millions of IoT signals every second from thousands of wind, solar, biogas, and hydroelectric energy assets around the globe—often in real-time.

ENGIE Digital selected Azure Time Series Insights and Microsoft Azure IoT Edge to modernize its platform. With these updates, the platform now supports ENGIE Digital teams across hundreds of renewable energy sites worldwide.

ShookIOT leverages Azure Time Series Insights to deliver customer insights


Oil and gas industry veterans, Dr. Dave Shook and Leanna Chan, have spent twenty years consulting with clients in the oil and gas industry. Time and time again, they see oil and gas companies struggling to leverage the full value of their data.

Traditionally companies store data in on-premises time-series database applications called historians; legacy operational technology (OT) tools that keep data siloed. This makes it difficult to connect with powerful information technology (IT) tools, such as cloud-based analytics. Additionally, collecting process data can be prohibitively expensive. Some process manufacturers store less than 75 percent of their data.

To address these challenges, the two entrepreneurs had a vision to fuse OT data with IT. They founded ShookIOT in Edmonton, Alberta, Canada in 2017. Their philosophy was to free data siloed on-premises and migrate it to the cloud—specifically the ShookIOT Fusion Cloud Historian running on Microsoft Azure. Once in the cloud, customers, such as Chevron, could harness the full value of their data leverage tools like Azure Time Series Insights.

Gain insights from large volumes of data easily


Explore and analyze billions of contextualized events across millions of industrial sensors. Uncover hidden trends, spot anomalies, and conduct root-cause analysis in large volumes of data with an intuitive and straightforward user experience.

Source: microsoft.com

Monday, 20 July 2020

What Is the 70-464 Exam? From Tip to Toe Everything About Microsoft 70-464 Certification

The Microsoft 70-464 certification exam is designed for those IT professionals and database experts who have to create, configure, and implement multiple Microsoft SQL Server Databases across their organizations. Additionally, this test helps database-related professionals to enhance their career options and get salary hikes as well.
70-464, Microsoft 70-464, 70-464 Exam, 70-464 exam paper, Developing Microsoft SQL Server Databases
Throughout the Microsoft 70-464 exam, the IT professionals discover how to ensure higher data availability levels and develop Microsoft SQL Server Databases. The certification granted after successfully passing the exam is always high in demand, and companies frequently prefer to use the database professionals with this credential.

Take the Microsoft 70-464 Exam

Though this certification test is designed for the database professionals, any IT professional can become a certified SQL Server database developer.

The primary line of work of such professionals is to develop and implement SQL Server databases for the organization and ensure data availability. As there are no strict requirements for taking the Microsoft 70-464 exam, anyone involved in working in the IT-sphere can decide to pass it.

If you have just completed your college and are interested in working as an SQL Server database developer, you should take this test without hesitation.

The abilities that you would have to take care of as a database developer include making multiple database files, creating data types and reports, planning and optimizing different indexes, implementing views, assuring data integrity, and handling all the transactions and locks.

If you require to establish your future career as a Microsoft SQL Server database developer, you should start your exam preparation!

Grasp Your Result with 70-464 Exam in Short Time

You will need to prepare to be completely ready for the 70-464 Microsoft Certified Professional exam, mainly since the course material is extensive. You will have to demonstrate awareness of various concepts, but you will also have to show that you even know how to implement the multiple theories.

The preparation for this 70-464 exam can take up quite a bit of your time, which you might not have if you are very new. Therefore, you need to get the best possible coaching program to help you make short work of the excellent course content. A unique training program will be absolutely up to date, and it will have all the information that you will be tested on.

It will also have a format that makes it easy for you to learn in the shortest possible time. The study materials for the MCSA 70-464 exam should also contain mock tests to know exactly what to expect when you get the actual 70-464 exam paper.

Schedule Your Exam

Follow the steps below to schedule your Microsoft certification exam:
  • Go to the Microsoft portal, to register yourself.
  • Click on Schedule Exam to schedule an exam date at your preference.
  • Fill all your details asked on the next page that looks.
  • Choose the exam delivery option on the Pearson VUE page.
  • Pay your exam fees.
  • You have successfully registered for the 70-464 Exam.

70-464 Exam Result

Right after completing your Exam 70-464: Developing Microsoft SQL Server Databases, you will be informed of your pass or fail status within a few minutes of making your exam. Printed reports giving your exam score and feedback on your review will also be provided to you. Your score will be given to Microsoft within five business days.
70-464, Microsoft 70-464, 70-464 Exam, 70-464 exam paper, Developing Microsoft SQL Server Databases
As far as Beta exam results are affected, your result will be visible on your Microsoft record. However, you will see your result only if you have achieved a passing score. This result will also be published on Pearson VUE’s site within 14 business days after the live exam is released.

Note: If you can clear the beta exam, you will earn Microsoft credit for that exam and receive a resulting certification. Moreover, you must not retake the exam in its live version after clearing its beta version.

70-464 Exam Retake Policy

If anyhow, you are not able to obtain a passing score in the Microsoft 70-464 exam. However, you will have to wait for a least 24 hours before you become available for a retake. Failure in the second attempt will result in a standing time of 14 days before rescheduling your third attempt. The waiting period for the fourth and the fifth attempts will also be 14 days. All candidates are allowed height of five attempts per year.

Cancellation Policy

Microsoft allows candidates to cancel or reschedule their exams within 24 hours before the exam date. However, to stop any cancellation fee, you must cancel or reschedule your exam at least six business days before the time scheduled for your exam. If you fail to appear in the exam, you will not receive any exam fee refund.

70-464 Recertification

Microsoft certification is expected to expire when the products are out of mainstream support, although the person`s certification will be recognized. Officially, the MCSA certification will never expire.

Conclusion

As passing the Microsoft 70-464 exam is not as easy as it may seem, you should get comfortable with all the test topics thoroughly. Please go through the exam objectives and try to guess them well. If you need support, you can check out the previous test-takers' reviews and see what they have to say regarding their experience.

Saturday, 18 July 2020

Preparing for what’s next: Financial considerations for cloud migration

In the kick off blog of this series, I shared our top recommendations to accelerate your cloud migration journey, one of which was around aligning key stakeholders across your organization. As you move through assessments and plan your migration, it is critical to get buy in from your CFO and other financial stakeholders—even more so in today’s challenging macro-climate.

IT and finance organizations need to be aligned around how to be agile to adjust to rapidly shifting demands while ensuring that their cost structure is lean enough to weather tough market conditions. With this dual focus, it is critical to understand not only the technical benefits of a cloud transition, but also the financial and economic opportunities associated with it. Today I'm sharing my own experience of partnering with finance along with the wisdom that customers have shared about their journey.

How can cloud migration affect CFO priorities?


Here are three key areas that IT organizations need to internalize and align on with their finance organization as they plan cloud migration:

1. What’s the holistic impact to the organization’s financial posture?
2. What will the impact be on external and internal finance KPIs and processes?
3. What operational changes are required during and after migration to ensure that budget/ROI controls are met?

How is the organization’s financial posture going to change?

Azure customers constantly unlock new, positive ROI projects previously not possible on-premises as they migrate workloads. By design, Azure is built to facilitate business agility, creating opportunities for true competitive advantage and substantial decrease in time to market. As a result, our customers recognize significant financial benefits driven in large part by cloud flexibility and elasticity and changes in businesses’ financial operating models that reduce asset purchases and upfront cash investments.

Cloud flexibility and elasticity

First, Azure customers can adjust their cost structure to improve their organization’s bottom line, which is table stakes in today’s environment. In recent earnings calls, CFOs of companies not leveraging the cloud mentioned their inability to reduce fixed expenses, which hurt profitability. As our customers migrate to Azure, they are shifting to a cost structure that is variable by design:

Figure 1: Cloud cost structure provides flexibility

Microsoft Tutorial and Material, Microsoft Learning, Azure Cloud, Azure Exam Prep

Next, Azure customers can maximize resource efficiency. We have worked directly with large and small customers alike who were running on-premises workloads at very low resource utilization. These customers purchased assets for peak demand and lead-times, but most of the time those servers, and even some datacenters, were sitting idle and underused. By rightsizing and optimizing capacity when migrating to Azure, customers can realize economic benefits from cloud scale and elasticity. As an example, the built-in scalability in Azure has helped Maersk quickly scale up on demand eliminating the need to maintain idle resources during off-peak times.

“Scalability is one of the big benefits we get from Azure. In the past, it might have taken us months to procure and configure servers and get them into production. Now, we can scale up on demand in Azure in a matter of minutes." - Musaddique Alatoor, Head of Equipment Innovation, A.P. Moller - Maersk

Finally, shifting to a cloud model can reduce costs by enabling customers to consume resources only during peak usage periods, while reducing capacity when demand needs drop.

Changes in the financial operating model

Key financial benefits of Azure are driven by a fundamental shift in the IT operating model, which benefits the organization’s core financial statements in the following ways:

◉ Balance sheet: Prior to migrating to Azure, many of our customers owned or operated their datacenters. These were expensive long-term assets that limited the cash and capital required to grow the business, support strategic initiatives, and respond to market conditions. Once on Azure, our customers avoid buying equipment, repurpose expensive real estate, and shift datacenter operations costs into developing cloud applications and other projects that drive business growth. This makes their balance sheet more agile, shifting fixed assets to cash. This is what drove Maersk to move their five regional datacenters to Azure to lower the company’s risks and position them for continued growth.

◉ Cash flow statement: Azure customers save immediate cash by avoiding cyclical and sporadic IT asset purchases. With the “pay for what you use” model along with platform capabilities like policy and tagging that Azure enables, CFOs increase visibility, predictability and delay cash spend.
Income statement (profit and loss): Over time, Azure customers can improve profitability by reducing the cost to deliver equal or larger IT value by taking advantage of Azure’s flexibility, low management costs, its broad portfolio of services and pricing models.

"We're now saving about 30 percent a year on infrastructure costs just by moving to Azure, with more flexibility, better servers, greater customization, and more freedom to do what we want." - Darren Gourley, Chief Technology Officer, CYTI

How will financial KPIs and processes change?

When migrating from on-premises to Azure, there are several financial benefits that subsequently impact KPIs and finance processes. The two most prominent are: 1) budget and financial reporting processes: expense shifts from capital expenditure (CAPEX) to operational expenditure (OPEX); 2) Impact on EBITDA (earnings before interest, taxes, depreciation, and amortization).

1. CAPEX to OPEX: During an Azure migration, spend that was previously allocated to CAPEX is now being redeployed to OPEX. This is optimal from a cashflow timing and a balance sheet flexibility perspective but requires CFOs to shift budgets to support the new model. Capstone Mining used this approach to significantly lower their capital costs by moving to Azure.

"We wanted to eliminate $3 million (USD) in capital costs over about three years, and to reduce our operating costs by approximately the same amount. At the same time, we wanted to improve our quality of service. With Azure, we're confident about meeting these goals." - Jim Slattery, Chief Financial Officer, Capstone Mining

2. EBITDA: EBITDA is a financial metric that companies use to measure profitability. This metric ignores real costs like server spend. When moving to the cloud, EBITDA is impacted because the metric can no longer ignore costs like server depreciation. When moving to the cloud, if your company tracks EBITDA, it will likely be impacted from a migration shift. As opposed to overly focusing on EBITDA, many customers choose to identify additional financial metrics that better measure business value improvements (such as cash flows, operating income, or cost of goods sold efficiency).

Managing financial KPI’s and processes is a critical component of a CFO’s job. By creating a channel of communication with your financial stakeholders and highlighting symbiotic relationships of some of the KPI and process impacts of a cloud migration, you can begin working with your finance team to proactively reset expectations around both capital/operating budgets and EBITDA targets in a cloud vs on-premises world.

Implementing the business case: Ongoing cost-optimization and management

Once the cloud migration project begins, here are a few tips and best financial practices for success:

1. Reducing on-premises asset acquisitions: There must be broad internal alignment and processes to evaluate and control how and when teams buy new on-premises assets. Every new purchase will add fixed costs that will prevent cloud savings for a longer period.

2. Initial resource clean-up, rightsizing, and optimization: When migrating to Azure, consider which workloads are no longer needed and can be turned off. For workloads still needed, consider what can be done to optimize those resources and operational hours, leveraging tools such as Azure Migrate.

3. Continuous cost optimization: Workloads aren’t static. Once in Azure, leverage our tools (including Azure Cost Management and Azure Advisor) and establish processes to monitor resources and patterns to continuously optimize cloud costs.

4. Resource tagging and spend categorization: Azure allows for simplified resource tagging and cost allocation compared with on-premises. This helps increase spend accountability, while evaluating workload ROI. Through resource tagging you are able to better align your spend to cost categories like the cost of goods sold (COGS) or research and development and allocate costs of workloads directly to underlying business units. Targeted cost allocation can directly help drive efficiencies and reductions.

5. Billing models: Azure billing models like reserved instances and spot pricing are fantastic opportunities to save money. As an example, Azure three-year Reserved Instances (RI) do not require upfront payment, have tremendous flexibility, and provide discounts up to 72 percent.

6. Azure Hybrid Benefit: With Azure you can take advantage of your existing Microsoft licenses with Software Assurance to avoid incremental licensing costs for migrating workloads and maximize previous investments.

Figure 2: Well-optimized cloud usage can free up excess capacity

Microsoft Tutorial and Material, Microsoft Learning, Azure Cloud, Azure Exam Prep

Aligning cloud spend with underlying workload usage

A) Idle capacity: Azure allows customers to eliminate idle capacity intended to cover future growth across workloads. Actions like rightsizing or eliminating unnecessary workloads can help you reduce your idle capacity when moving to the cloud.

B) Variable workloads: Azure customers only pay for the hours they need when demand temporarily peaks above average levels on variable workloads. Taking advantage of tools and actions like VM scale sets and “snoozing” can help you only pay for the resources needed.

C) Predictable workloads: Azure customers can minimize costs of predictable workloads by taking advantage of Azure Reserved Instances and Spot prices.

Source: microsoft.com

Thursday, 16 July 2020

Save up to 76 percent on Azure Synapse Analytics and gain breathtaking insights of your ERP data

To help customers save on data warehouse migration costs and accelerate time-to-insight on critical SAP data, we are announcing two new analytics offers from Azure Synapse Analytics.

Business disruptions, tactical pivots, and remote work have all emphasized the critical role analytics plays for every organization. Uncharted situations demand charted performance insights, so businesses can quickly determine what is and is not working. In recent months, the urgency for these business-guiding insights has only been heightened—leading to a need for real-time analytics solutions. And equally important is the need to discover and share these insights in the most cost-effective manner.

Azure Synapse has you covered. It is the undisputed leader in price-performance and when compared to other cloud providers is up to 14 times faster and costs 94 percent less. In fact, businesses using Azure Synapse today report an average ROI of 271 percent.

To help customers get started today, we are announcing the following new offers aimed at empowering businesses to act now wherever they are on their cloud analytics journey.

Save up to 76 percent when migrating to Azure Synapse


For customers that use an on-premises data warehouse, migrating to the cloud offers both significant cost savings and accelerated access to innovative features. Today, customers experience cost savings with our existing reserved capacity discount for cloud data warehousing with Azure Synapse. To boost these cost savings further, today we are announcing a new limited time offer that provides additional savings on top of the existing reserved capacity discount—enabling qualifying customers who currently use an on-premises data warehouse to save up to 76 percent when migrating to Azure Synapse.

To learn more about the terms and conditions and the qualification criteria of this offer, contact your Microsoft account representative. The migration offer is available until January 31, 2021.

Gain breathtaking insights of your ERP data with new offering from Azure, Power BI, and Qlik Data Integration


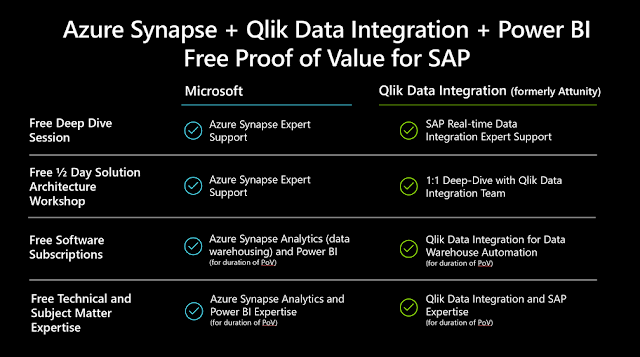
For companies worldwide, SAP data is at the core of their business applications—housing critical information on sales, manufacturing, and financial processes. However, due to the inherent complexity of SAP systems, many organizations struggle to integrate SAP data into modern analytics projects. To enable businesses to gain real-time insights from their SAP data, we are announcing a new joint offer with Qlik (formerly Attunity) that brings Azure Synapse, Power BI, and Qlik Data Integration together for end-to-end supply chain intelligence, finance analytics, and more.

With this new offer, customers can now work with Azure, Power BI, and Qlik Data Integration to easily understand how to enable real-time insights on SAP data through a robust proof of value. This joint proof-of-value offer provides customers a free solution architecture workshop, software subscriptions, and hands-on technical expertise from dedicated personnel and resources from both Microsoft and Qlik.

Microsoft Tutorial and Material, Microsoft Exam Prep, Azure Certification, Azure Learning