Microsoft and Dynatrace announced the general availability of Azure Native Dynatrace Service in August 2022. The native integration enables organizations to leverage Dynatrace as a part of their overall Microsoft Azure solution. Users can onboard easily to start monitoring their workloads by deploying and managing a Dynatrace resource on Azure.
Azure Native integration enables you to create a Dynatrace environment like you would create any other Azure resource. One of the key advantages of this integration is the ability to seamlessly ship logs and metrics to Dynatrace. By leveraging Dynatrace OneAgent, users can also gather deeper observability data from compute resources such as virtual machines and Azure App Services. This comprehensive data collection ensures that organizations have a holistic view of their Azure workloads and can proactively identify and resolve issues.
Furthermore, the integration unifies billing for Azure services, including Dynatrace. Users receive a single Azure bill that encompasses all the services consumed on the platform, providing a unified and convenient billing experience.
Since its release, Dynatrace Service has seen continuous enhancements. In the following sections, we will explore some of the newer capabilities that have been added to further empower organizations in their monitoring and observability efforts.
Automatic shipping of Azure Monitor platform metrics
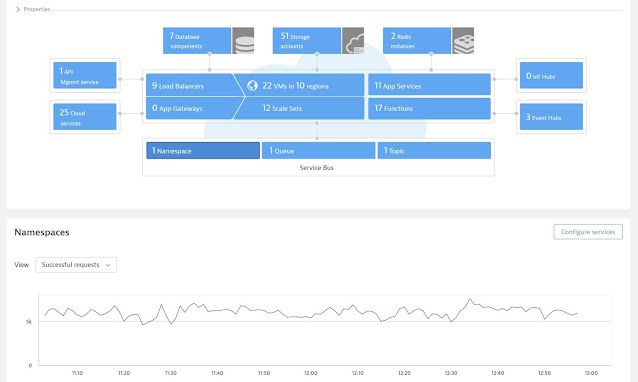
One of the significant advancements during the general availability of Azure Native Dynatrace Service was the automatic forwarding of logs from Azure Monitor to Dynatrace. The log forwarding capability allows you to configure and send Azure Monitor logs to Dynatrace. Logs start to flow to your Dynatrace environment as soon as the Dynatrace resource on Azure is deployed. The Azure experience allows you to view the summary of all the resources being monitored in your subscription.
Building further, we have now added another key improvement and that is the ability to automatically obtain metrics from the Azure Monitor platform. This enhancement enables users to effectively view the metrics of various services within Azure on the Dynatrace portal.
To enable metrics collection, customers can simply check a single checkbox on the Azure portal. This streamlined process makes it easy for organizations to start gathering valuable insights. For further customization, users have the option to specify tags to include or exclude specific resources for metric collection. This allows for a more targeted monitoring approach based on specific criteria.
The setup of credentials required for the interaction between Dynatrace and Azure is automated, eliminating the need for manual configuration. Once the metrics are collected, users can conveniently view and analyze them on the Dynatrace portal, providing a comprehensive and centralized platform for monitoring and observability.
Together with logs and metrics monitoring capabilities, Azure Native Dynatrace Service provides holistic monitoring of your Azure workloads.
Native integration availability in new Azure regions
During general availability, Azure Native Dynatrace Service was available in two regions, the Eastern United States and Western Europe. However, to cater to the growing demand, native integration is now available in additional regions. You can now create a Dynatrace resource in—The United Arab Emirates North (Middle East), Canada Central, and the Western United States—bringing the total number of supported regions to five. You can select the region in the resource creation experience. When selecting a region to provision a Dynatrace resource, the corresponding Dynatrace environment is provisioned in the same Azure region. This ensures that your data remains within the specified region. Hence, it gives you the power to leverage the power of Dynatrace within the Azure region while complying with the specific data residency regulations and preferences of your organization.
Monitor activity with Azure Active Directory logs
In the realm of cloud business, early detection of security threats is crucial to safeguarding business operations. Azure Active Directory (Azure AD) activity logs—encompassing audit, sign-in, and provisioning logs—offer organizations essential visibility into the activities taking place within their Azure AD tenant. By monitoring these logs, organizations can gain insights into user and application activities, including user sign-in patterns, application changes, and risk activity detection. This level of visibility empowers organizations to respond swiftly and effectively to potential threats, enabling proactive security measures and minimizing the impact of security incidents on their operations.
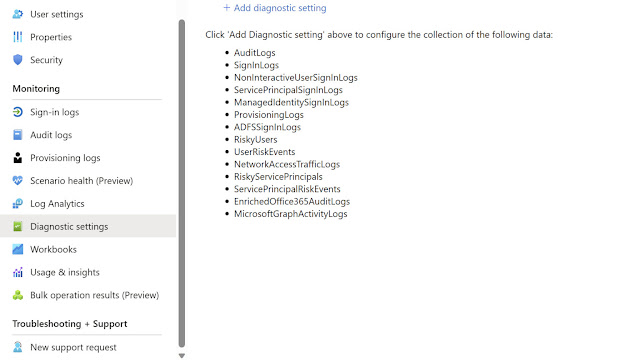
With Azure Native Dynatrace Service, you can route your Azure AD logs to Dynatrace by setting Dynatrace as a destination in Azure AD diagnostic settings.
Committed to collaboration and integration
The Azure Native integration for Dynatrace has simplified the process of gaining deep insights into workloads. This integration empowers organizations to optimize their resources, enhance application performance, and deliver high availability to their users. Microsoft and Dynatrace remain committed to collaborating and improving the integration to provide a seamless experience for their joint customers. By working together, both companies strive to continually enhance the monitoring and observability capabilities within the Azure ecosystem.
The product is constantly evolving to deepen the integration, aiming to monitor a wide range of Azure workloads and uplift user convenience throughout the experience.
Source: microsoft.com


0 comments:
Post a Comment