Wednesday, 30 January 2019

Azure Security Center can detect emerging vulnerabilities in Linux

Recently a new flaw was discovered in PolKit - a component which controls system-wide privileges in Unix OS. This vulnerability potentially allows unprivileged account to have root permission. In this blog post, we will focus on the recent vulnerability, demonstrate how attacker can easily abuse and weaponize it. In addition, we will preset how Azure Security Center can help you detect threats, and provide recommendations for mitigation steps.

The PolKit vulnerability


PolKit (previously known as PolicyKit) is a component that provides centralized way to define and handle policies and controls system-wide privileges in Unix OS. The vulnerability CVE-2018-19788 was caused due to improper validation of permission requests. It allows a non-privileged user with user id greater than the maximum integer to successfully execute arbitrary code under root context.

The vulnerability exists within PolKit’s versions earlier than 0.115, which comes pre-installed by some of the most popular Linux distributions. A patch was released, but it required a manual install by the relevant package manager issuer.
You can check if your machine is vulnerable by running the command “pkttyagent -version” and verify that your PolKit’s version is not vulnerable.

How an attacker can exploit this vulnerability to gain access to your environment


We are going to demonstrate a simple exploitation inspired from a previously published proof of concept (POC). The exploitation shows how an attacker could leverage this vulnerability for achieve privilege escalation technique and access restrict files. For this demonstration, we will use one of the most popular Linux distributions today.

First, we verify that we are on vulnerable machine by checking the PolKit version. Then, we verify that the user ID is greater than the maximal integer value.

Azure Security Center, Azure Certification, Azure Guides, Azure Tutorial and Material

Now, that we know we are on vulnerable machine, we can leverage this flaw by using another pre-installed tool, Systemctl, that uses PolKit as the permission policy enforcer and has the ability to execute arbitrary code. If you take closer look into CVE-2018-19788, you would find Systemctl is impacted by the vulnerability. Systemctl is one of Systemd utilities, and the system manager that is becoming the new foundation for building with Linux.

Using Systemctl, we will be able to create a new service in order to execute our malicious command with root context. Because of the flaw in PolKit, we can bypass the permission checks and runs systemctl operations. Let’s take a look at how we can do that.

Bash script content:

#!/bin/bash
cat <<EOF >> /tmp/polKitVuln.service
[Unit]
Description= Abusing PolKit Vulnerability
[Service]
ExecStart=/bin/bash -c 'cat /etc/sudoers > /tmp/sudoersList.txt'
Restart=on-failure
RuntimeDirectoryMode=0755

[Install]
WantedBy=multi-user.target
Alias= polKitVuln.service
EOF

systemctl enable /tmp/polKitVuln.service
systemctl start polKitVuln.service

First, we define a new service and provides the required information to “/tmp/polkitVuln.service”. The ExecStart directive contains our command (bolded above), accesses the sudoers file, and copies its content to a share folder. This shared folder can be accessed by unprivileged users. The Sudoers file is one of the most important files in the system, as it contains the users and groups privileges information of the machine. At the last part of the script, we make the actual call for systemctl tool to create and start our new service.

Execute the script:

Azure Security Center, Azure Certification, Azure Guides, Azure Tutorial and Material

Notice the errors regarding Polkit failing to handle the uid field. As the Sudoers file is copied using the exploitation, we can read its content.

Azure Security Center, Azure Certification, Azure Guides, Azure Tutorial and Material

With this vulnerability attackers can bypass permissions to check and gain root access to your environment.

Protect against and respond to threats with Azure Security Center


Azure Security Center can help detect threats, such as the PolKit vulnerability, and help you quickly mitigate these risks. Azure Security Center consolidates your security alerts into a single dashboard, making it easier for you to see the threats in your environment and prioritize your response to threats. Each alert gives you a detailed description of the incident as well as steps on how to remediate the issue.

While we investigate Azure Security Center hosts impact, we could determine what is the frequency in which machines are under attack and using behavioral detection techniques, inform customers when they have been attacked. Below is the security alert based on our previous activity which you can see in Security Center.

Azure Security Center, Azure Certification, Azure Guides, Azure Tutorial and Material

In addition, Azure Security Center provides a set of steps that enable customers to quickly remediate the problem:

◈ System administration should not allow negative user IDs or user IDs greater than 2147483646.
     ◈ Verify user ID maximum and minimum values under “/etc/login.defs.”
◈ Upgrade your policykit package by the package manager in advance.

Tuesday, 29 January 2019

Development, source control, and CI/CD for Azure Stream Analytics jobs

Do you know how to develop and source control your Microsoft Azure Stream Analytics (ASA) jobs? Do you know how to setup automated processes to build, test, and deploy these jobs to multiple environments? Stream Analytics Visual Studio tools together with Azure Pipelines provides an integrated environment that helps you accomplish all these scenarios. This article will show you how and point you to the right places in order to get started using these tools.

In the past it was difficult to use Azure Data Lake Store Gen1 as the output sink for ASA jobs, and to set up the related automated CI/CD process. This was because the OAuth model did not allow automated authentication for this kind of storage. The tools being released in January 2019 support Managed Identities for Azure Data Lake Storage Gen1 output sink and now enable this important scenario.

This article covers the end-to-end development and CI/CD process using Stream Analytics Visual Studio tools, Stream Analytics CI.CD NuGet package, and Azure Pipelines. Currently Visual Studio 2019, 2017, and 2015 are all supported. If you haven’t tried the tools, follow the installation instructions to get started!

Job development


Let’s get started by creating a job. Stream Analytics Visual Studio tools allows you to manage your jobs using a project. Each project consists of an ASA query script, a job configuration, and several input and output configurations. Query editing is very efficient when using all the IntelliSense features like error markers, auto completion, and syntax highlighting.

Azure Tutorial and Material, Azure Guides, Azure Learning, Azure Study Material

If you have existing jobs and want to develop them in Visual Studio or add source control, just export them to local projects first. You can do this from the server explorer context menu for a given ASA job. This feature can also be used to easily copy a job across regions without authoring everything from scratch.

Azure Tutorial and Material, Azure Guides, Azure Learning, Azure Study Material

Developing in Visual Studio also provides you with the best native authoring and debugging experience when you are writing JavaScript user defined functions in cloud jobs or C# user defined functions in Edge jobs.

Source control


When created as projects, the query and other artifacts sit on the local disk of your development computer. You can use the Azure DevOps, formerly Visual Studio Team Service, for version control or commit code directly to any repositories you want. By doing this you can save different versions of the .asaql query as well as inputs, outputs, and job configurations while easily reverting to previous versions when needed.

Azure Tutorial and Material, Azure Guides, Azure Learning, Azure Study Material

Testing locally


During development, use local testing to iteratively run and fix code with local sample data or live streaming input data. Running locally starts the query in seconds and makes the testing cycle much shorter.

Testing in the cloud


Once the query works well on your local machine, it’s time to submit to the cloud for performance and scalability testing. Select “Submit to Azure” in the query editor to upload the query and start the job running. You can then view the job metrics and job flow diagram from within Visual Studio.

Azure Tutorial and Material, Azure Guides, Azure Learning, Azure Study Material

Azure Tutorial and Material, Azure Guides, Azure Learning, Azure Study Material

Setup CI/CD pipelines


When your query testing is complete, the next step is to setup your CI/CD pipelines for production environments. ASA jobs are deployed as Azure resources using Azure Resource Manager (ARM) templates. Each job is defined by an ARM template definition file and a parameter file.

There are two ways to generate the two files mentioned above:

1. In Visual Studio, right click your project name and select “Build.”
2. On an arbitrary build machine, install Stream Analytics CI.CD NuGet package and run the command “build” only supported on Windows at this time. This is needed for an automated build process.

Performing a “build” generates the two files under the “bin” folder and lets you save them wherever you want.

Azure Tutorial and Material, Azure Guides, Azure Learning, Azure Study Material

The default values in the parameter file are the ones from the inputs/outputs job configuration files in your Visual Studio project. To deploy in multiple environments, replace the values via a simple power shell script in the parameter file to generate different versions of this file to specify the target environment. In this way you can deploy into dev, test, and eventually production environments.

Azure Tutorial and Material, Azure Guides, Azure Learning, Azure Study Material

As stated above, the Stream Analytics CI.CD NuGet package can be used independently or in the CI/CD systems such as Azure Pipelines to automate the build and test process of your Stream Analytics Visual Studio project.

Wednesday, 23 January 2019

Connecting Node-RED to Azure IoT Central

Today I want to show how simple it is to connect a temperature/humidity sensor to Azure IoT Central using a Raspberry Pi and Node-RED.

As many of you know, Raspberry Pi is a small, single-board computer. Its low cost, low power nature makes it a natural fit for IoT projects. Node-RED is a flow-based, drag and drop programming tool designed for IoT. It enables the creation of robust automation flows in a web browser, simplifying IoT project development.

For my example, I’m using a Raspberry Pi 3 Model B and a simple DHT22 temperature and humidity sensor, but it should work with other models of the Pi. If you have a different kind of sensor, you should be able to adapt the guide below to use it, provided you can connect Node-RED to your sensor.

Configuring Azure IoT Central


1. Create an app.
2. Create a new device template.

◈ Temp (temp)
◈ Humidity (humidity)

3. Create a real device and get the DPS connection information.
4. Use dps-keygen to provision the device and get a device connection string.

◈ Identify the three parts of the resulting connection string and save them for later.

Connecting the DHT22 sensor


Before we can get data from our DHT22 sensor, we need to connect it to the pi. The DHT22 typically has three pins broken out, but some of them have four. If you have one with four, check the datasheet to confirm which pins are voltage (may be shown as +, VCC or VDD), data (or signal), and ground.

With the pi powered off, use jumper wires to connect your DHT22 as shown below:

Azure Tutorial and Material, Azure Guides, Azure Certification, Azure Study Materials

NOTE: The power jumper (red) should go to 3.3V, data jumper (yellow) should go to GPIO4 and the ground jumper (black) should go to ground. Some boards are different, so double-check your connections!

Installing required software

I started by installing Raspbian Lite using the guide. Then, I installed Node-RED. At this point you should be able to open a browser and visit http://raspberrypi.lan:1880 to see the Node-RED interface. Next, install the Azure IoT Hub nodes for Node-RED. The easiest way to do this is from the Node-RED interface, using the Manage Palette command.

Install the DHT22 nodes. Unfortunately, since this node has some lower-level hardware requirements, it can’t be installed through the Manage Palette command. Please follow the instructions using the link above.

Configuring the flow


Now that you have Node-RED up and running on your pi, you’re ready to create your flow. By default, Node-RED should already have a flow called “Flow 1,” but if you can easily create a new one by selecting the (+) icon above the canvas.
Starting the flow with the inject node

The first node we will add to this flow is an input node. For this example, we will use the inject node which simply injects an arbitrary JSON document into the flow. From the input section in the palette, drag the node from the palette on the left onto the canvas. Then, double select it to open the configuration window. Set the node properties as shown below:

Azure Tutorial and Material, Azure Guides, Azure Certification, Azure Study Materials

This node will simply inject a JSON object where the payload is set to a timestamp. We don’t really care about that value. This is just a simple way to kick off the flow.

Getting data from the DHT22

In the Node-RED palette, find the rpi dht22 node and drag it onto the canvas. Double click on it to open the configuration window, and set the node properties as shown below:

Azure Tutorial and Material, Azure Guides, Azure Certification, Azure Study Materials

Connect the inject node to the rpi dht22 node by dragging the little handle from one to the other.

Reformatting the message

The JSON message produced by the DHT22 node isn’t formatted correctly for sending to Azure IoT, so we need to fix that. We will use the change node to do this, so drag it out from the palette onto the canvas and connect it to the DHT22 node. Double click on it to open the configuration window and set the node properties as shown below:

Azure Tutorial and Material, Azure Guides, Azure Certification, Azure Study Materials

For the functional part of this node, we will use JSONata, which is a query and transformation language for JSON documents. After selecting the JSONata type in the to selector, select the […] button to open the editor and enter the following:

Azure Tutorial and Material, Azure Guides, Azure Certification, Azure Study Materials

Here we are extracting the temperature and humidity values from the input JSON message and putting them inside the data element in the resulting JSON message. We’re also adding the device ID and shared access key which you got from the Device Connection String earlier.

Sending the data to Azure IoT Central

Now that we’ve got the JSON message ready, find the Azure IoT Hub node in the palette and drag it onto the canvas. Again, double click on it to open the configuration window and set the properties as shown here:

Azure Tutorial and Material, Azure Guides, Azure Certification, Azure Study Materials

Confirming your message and debugging

The final node we will add to our flow is a debug node, which simply outputs the message it is given to the debug panel in Node-RED. Connect it to the end of the flow (after Azure IoT Hub) and set the name to “Hub Response.”

If you’re interested in seeing the JSON message at any point in the flow, you can add more debug nodes anywhere you want. You can enable or disable the output of a debug node by selecting the little box on the right side of the node.

The flow

Here is what your flow should look like. I’ve added a couple of extra debug nodes while developing this flow, but you can see that only the Hub Response node is enabled.

Azure Tutorial and Material, Azure Guides, Azure Certification, Azure Study Materials

Before you can run the flow, you need to deploy it from the workspace. To do this select the red Deploy button at the top right of the Node-RED screen. Then, simply select the little box on the left of the every minute node and it will start. Since we configured that node to run every minute, it will continue to send messages to Azure IoT Central until you stop it by either disabling the flow or redeploying.

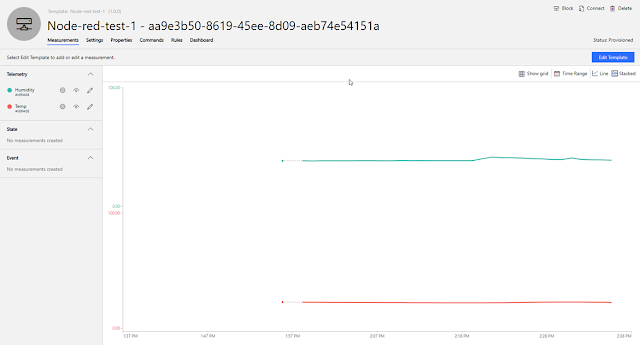
Pop back over to your IoT Central app and you should start seeing data within a minute or so.

Azure Tutorial and Material, Azure Guides, Azure Certification, Azure Study Materials

As you can see, connecting Node-RED to Azure IoT Central is pretty simple. This is a great way to quickly prototype and experiment with different sensors and message payloads without having to write any code! You can also use this approach for creating gateways or protocol translators so you can easily connect almost anything to Azure IoT Central.

Appendix: Flow source


If you want to just copy-paste the whole thing in instead of building it up yourself, you can import the following JSON into Node-RED and just update the three values from your Device Connection String (see the instructions above).

[{"id":"9e47273a.f12738", "type":"tab", "label":"DHT22-IoTC", "disabled":false, "info":""}, {"id":"b3d8f5b6.a243b8", "type":"debug", "z":"9e47273a.f12738", "name":"Hub Response", "active":true, "tosidebar":true, "console":false, "tostatus":false, "complete":"true", "x":740, "y":340, "wires":[]}, {"id":"117b0c09.6b3a04", "type":"azureiothub", "z":"9e47273a.f12738", "name":"Azure IoT Hub", "protocol":"mqtt", "x":520, "y":340, "wires":[["b3d8f5b6.a243b8"]]}, {"id":"ee333823.1d33a8", "type":"inject", "z":"9e47273a.f12738", "name":"", "topic":"", "payload":"", "payloadType":"date", "repeat":"60", "crontab":"", "once":false, "onceDelay":"", "x":210, "y":120, "wires":[["38f14b0d.96eb14"]]}, {"id":"38f14b0d.96eb14", "type":"rpi-dht22", "z":"9e47273a.f12738", "name":"", "topic":"rpi-dht22", "dht":22, "pintype":"0", "pin":4, "x":400, "y":120, "wires":[["f0bfed44.e988b"]]}, {"id":"f0bfed44.e988b", "type":"change", "z":"9e47273a.f12738", "name":"", "rules":[{"t":"set", "p":"payload", "pt":"msg", "to":"{\t \"deviceId\":\"{YOUR DEVICE ID} \", \t \"key\":\"{YOUR KEY}\", \t \"protocol\":\"mqtt\", \t \"data\": {\t \"temp\": $number(payload), \t \"humidity\": $number(humidity)\t \t }\t\t}", "tot":"jsonata"}], "action":"", "property":"", "from":"", "to":"", "reg":false, "x":280, "y":340, "wires":[["117b0c09.6b3a04", "db5b70be.81e2a"]]}, {"id":"db5b70be.81e2a", "type":"debug", "z":"9e47273a.f12738", "name":"Payload", "active":true, "tosidebar":true, "console":false, "tostatus":false, "complete":"payload", "x":500, "y":420, "wires":[]}]

Tuesday, 22 January 2019

Export data in near real-time from Azure IoT Central

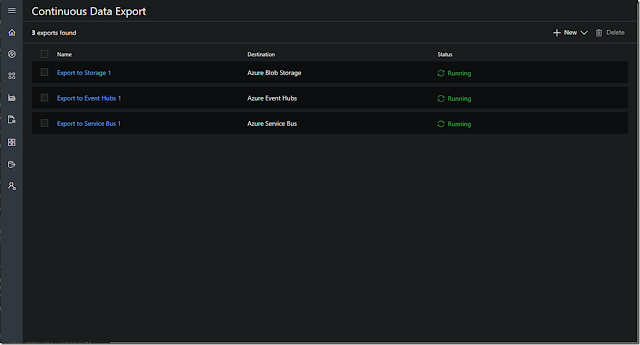
We are happy to share that you can now export data to Azure Event Hubs and Azure Service Bus in near real-time from your Azure IoT Central app! Previously, Continuous Data Export enabled exporting your IoT Central measurements, devices, and device templates data to your Azure Blob Storage account once every minute for cold path storage and analytics. Now you can export this data in near real-time to your Azure Event Hubs and Azure Service Bus instances for analytics and monitoring.

For example, an energy company wants to understand and predict trends in energy consumption in different areas over time of day and throughout the week. With electrical equipment connected to IoT Central, they can use Continuous Data Export to export their IoT data to Azure Event Hubs. They run their deployed machine learning models to gain insight over consumption and perform anomaly detection by connecting their Event Hubs to Azure Databricks. They can run highly custom rules for detecting specific outages by sending data from Event Hubs to Azure Stream Analytics. For long term data storage, they can continue to use Continuous Data Export to store all of their device data in Azure Blob Storage.

Azure IoT Central, Azure Certification, Azure Study Materials, Azure Guides, Azure Tutorial and Material

Continuous Data Export in Azure IoT Central

New capabilities


These are the new features and changes to Continuous Data Export in Azure IoT Central:

◈ New export destinations include Azure Event Hubs and Azure Service Bus, in addition to Azure Blob Storage.
◈ Export to all supported destinations using a valid connection string, including destinations that are in a different subscription than your IoT Central app.
◈ Create up to 5 exports per app.
◈ Export is available in both Trial apps and Pay-As-You-Go apps.
◈ Continuous Data Export has moved! Find it in the left navigation menu.

Thursday, 17 January 2019

Azure Data Explorer plugin for Grafana dashboards

Are you using Azure Data Explorer to query vast amounts of data? Are you following business metrics and KPIs with Grafana dashboards? Creating a Grafana data source with Azure Data Explorer has never been easier.

Grafana is a leading open source software designed for visualizing time series analytics. It is an analytics and metrics platform that enables you to query and visualize data and create and share dashboards based on those visualizations. Combining Grafana’s beautiful visualizations with Azure Data Explorer’s snappy ad hoc queries over massive amounts of data, creates impressive usage potential.

The Grafana and Azure Data Explorer teams have created a dedicated plugin which enables you to connect to and visualize data from Azure Data Explorer using its intuitive and powerful Kusto Query Language. In just a few minutes, you can unlock the potential of your data and create your first Grafana dashboard with Azure Data Explorer.

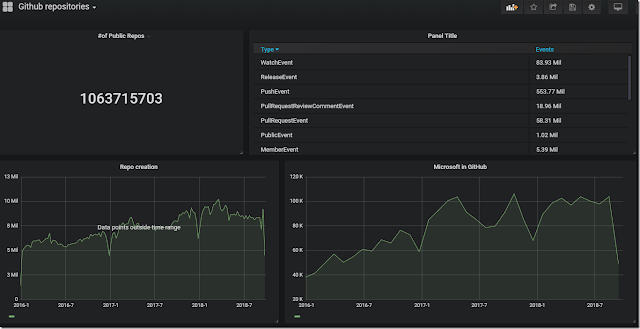
Once you build an Azure Data Explorer data source in Grafana, you can create a dashboard panel and select Edit to add your query.

Azure Certification, Azure Guides, Azure Learning, Azure Tutorial and Material

Kusto Query Language is available for executing queries in the Metrics tab. The built-in intellisense which proposes query term completion, assists in query formulation. You run the query to visualize the data.

GithubEvent
| where Repo.name has 'Microsoft'
| summarize TotalEvents = count() by bin(CreatedAt,30d)
|order by CreatedAt asc

Azure Certification, Azure Guides, Azure Learning, Azure Tutorial and Material

Azure Certification, Azure Guides, Azure Learning, Azure Tutorial and Material

Tuesday, 15 January 2019

Create alerts to proactively monitor your data factory pipelines

Data integration is complex and helps organizations combine data and business processes in hybrid data environments. The increase in volume, variety, and velocity of data has led to delays in monitoring and reacting to issues. Organizations want to reduce the risk of data integration activity failures and the impact it cause to other downstream processes. Manual approaches to monitoring data integration projects are inefficient and time consuming. As a result, organizations want to have automated processes to monitor and manage data integration projects to remove inefficiencies and catch issues before they affect the entire system. Organizations can now improve operational productivity by creating alerts on data integration events (success/failure) and proactively monitor with Azure Data Factory.

To get started, simply navigate to the Monitor tab in your data factory, select Alerts & Metrics, and then select New Alert Rule.

Azure Certification, Azure Learning, Azure Guides, Azure Tutorial and Material

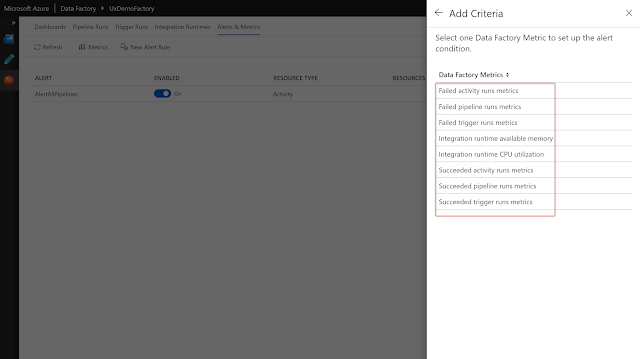
Select the target data factory metric for which you want to be alerted.

Azure Certification, Azure Learning, Azure Guides, Azure Tutorial and Material

Azure Certification, Azure Learning, Azure Guides, Azure Tutorial and Material

Then, configure the alert logic. You can specify various filters such as activity name, pipeline name, activity type, and failure type for the raised alerts. You can also specify the alert logic conditions and the evaluation criteria.

Azure Certification, Azure Learning, Azure Guides, Azure Tutorial and Material

Finally, configure how you want to be alerted. Different mechanisms such email, SMS, voice, and push notifications are supported.

Azure Certification, Azure Learning, Azure Guides, Azure Tutorial and Material

Creating alerts will ensure 24/7 monitoring of your data integration projects and make sure that you are notified of issues before they potentially corrupt your data or affect downstream processes. This helps your organizations to be more agile and increase confidence in your overall data integration processes. This ultimately results in increasing overall productivity in your organizations, and guarantee that you deliver on your SLAs.

Saturday, 12 January 2019

Best practices for alerting on metrics with Azure Database for MariaDB monitoring

Microsoft’s Azure Database for open sources announced the general availability of MariaDB. This blog intends to share some guidance and best practices for alerting on the most commonly monitored metrics for MariaDB.

Whether you are a developer, a database analyst, a site reliability engineer, or a DevOps professional at your company, monitoring databases is an important part of maintaining the reliability, availability, and performance of your MariaDB server. There are various metrics available for you in Azure Database for MariaDB to get insights on the behavior of the server. You can also set alerts on these metrics using the Azure portal or Azure CLI.

Azure Database, Azure MariaDB, Azure Tutorial and Material, Azure Guides, Azure Certification

With modern applications evolving from a traditional on-premises approach to becoming more hybrid or cloud native, there is also a need to adopt some best practices for a successful monitoring strategy on a hybrid/public cloud. Here are some example best practices on how you can use monitoring data on your MariaDB server and areas you can consider improving based on these various metrics.

Active connections


Sample threshold (percentage or value): 80 percent of total connection limit for greater than or equal to 30 minutes, checked every five minutes.

Things to check

If you notice that active connections are at 80 percent of the total limit for the past half hour, verify if this is expected based on the workload.
If you think the load is expected, active connections limits can be increased by upgrading the pricing tier or vCores.

Azure Database, Azure MariaDB, Azure Tutorial and Material, Azure Guides, Azure Certification

Failed connections


Sample threshold (percentage or value): 10 failed connections in the last 30 minutes, checked every five minutes.

Things to check

If you see connection request failures over the last half hour, verify if this is expected by checking the logs for failure reasons.

Azure Database, Azure MariaDB, Azure Tutorial and Material, Azure Guides, Azure Certification

◈ If this is a user error, take the appropriate action. For example, if authentication yields a failed error check your username/password.
◈ If the error is SSL related, check the SSL settings and input parameters are properly configured.
     ◈ Example: psql "sslmode=verify-ca sslrootcert=root.crt host=mydemoserver.mariadb.database.azure.com dbname=mariadb user=mylogin@mydemoserver"

CPU percent or memory percent


Sample threshold (percent or value): 100 percent for five minutes or 95 percent for more than two hours.

Things to check

◈ If you have hit 100 percent CPU or memory usage, check your application telemetry or logs to understand the impact of the errors.
◈ Review the number of active connections. If your application has exceeded the max connections or is reaching the limits, then consider scaling up compute.

IO percent


Sample threshold (percent or value): 90 percent usage for greater than or equal to 60 minutes.

Things to check

◈ If you see that IOPS is at 90 percent for one hour or more, verify if this is expected based on the application workload.
◈ If you expect a high load, then increase the IOPS limit by increasing storage. 

Storage


The storage you provision is the amount of storage capacity available to your Azure Database for PostgreSQL server. The storage is used for the database files, temporary files, transaction logs, and the PostgreSQL server logs. The total amount of storage you provision also defines the I/O capacity available to your server.

Basic General purpose  Memory optimized 
Storage type Azure Standard Storage Azure Premium Storage Azure Premium Storage 
Storage size  5GB TO 1TB  5GB to 4TB  5GB to 4TB 
Storage increment size  1GB  1GB  1GB
IOPS Variable  3IOPS/GB
Min 100 IOPS
Max 6000 IOPS 
3IOPS/GB
Min 100 IOPS
Max 6000 IOPS

Storage percent


Sample threshold (percent or value): 80 percent

Friday, 11 January 2019

Performance troubleshooting using new Azure Database for PostgreSQL features

At Ignite 2018, Microsoft’s Azure Database for PostgreSQL announced the preview of Query Store (QS), Query Performance Insight (QPI), and Performance Recommendations (PR) to help ease performance troubleshooting, in response to customer feedback. This blog intends to inspire ideas on how you can use features that are currently available to troubleshoot some common scenarios.

This blog nicely categorizes the problem space into several areas and the common techniques to rule out possibilities to quickly get to the root cause. We would like to further expand on this with the help of these newly announced features (QS, QPI, and PR).

In order to use these features, you will need to enable data collection by setting pg_qs.query_capture_mode and pgms_wait_sampling.query_capture_mode to ALL.

Azure Certification, Azure Guides, Azure Tutorial and Material, Azure Learning

You can use Query Store for a wide variety of scenarios where you can enable data collection to help with troubleshooting these scenarios better. In this article, we will limit the scope to regressed queries scenario.

Regressed queries


One of the important scenarios that Query Store enables you to monitor is the regressed queries. By setting pg_qs.query_capture_mode to ALL, you get a history of your query performance over time. We can leverage this data to do simple or more complex comparisons based on your needs.

One of the challenges you face when generating a regressed query list is the selection of comparison period in which you baseline your query runtime statistics. There are a handful of factors to think about when selecting the comparison period:

◉ Seasonality: Does the workload or the query of your concern occur periodically rather than continuously?
◉ History: Is there enough historical data?
◉ Threshold: Are you comfortable with a flat percentage change threshold or do you require a more complex method to prove the statistical significance of the regression?

Now, let’s assume no seasonality in the workload and that the default seven days of history will be enough to evaluate a simple threshold of change to pick regressed queries. All you need to do is to pick a baseline start and end time, and a test start and end time to calculate the amount of regression for the metric you would like to track.

Looking at the past seven-day history, compared to last two hours of execution, below would give the top regressed queries in the order of descending percentage. Note that if the result set has negative values, it indicates an improvement from baseline to test period when it’s zero, it may either be unchanged or not executed during the baseline period.

create or replace function get_ordered_query_performance_changes(
baseline_interval_start int,
baseline_interval_type text,
current_interval_start int,
current_interval_type text)
returns table (
     query_id bigint,
     baseline_value numeric,
     current_value numeric,
     percent_change numeric
) as $$
with data_set as (
select query_id
, round(avg( case when start_time >= current_timestamp - ($1 || $2)::interval and start_time < current_timestamp - ($3 || $4)::interval then mean_time else 0 end )::numeric,2) as baseline_value
, round(avg( case when start_time >= current_timestamp - ($3 || $4)::interval then mean_time else 0 end )::numeric,2) as current_value
from query_store.qs_view where query_id != 0 and user_id != 10 group by query_id ) , 
query_regression_data as (
select *
, round(( case when baseline_value = 0 then 0 else (100*(current_value - baseline_value) / baseline_value) end )::numeric,2) as percent_change 
from data_set ) 
select * from query_regression_data order by percent_change desc;
$$
language 'sql';

If you create this function and execute the following, you will get the top regressed queries in the last two hours in descending order compared to their calculated baseline value over the last seven days up to two hours ago.

select * from get_ordered_query_performance_changes (7, 'days', 2, 'hours');

Azure Certification, Azure Guides, Azure Tutorial and Material, Azure Learning

The top changes are all good candidates to go after unless you do expect the kind of delta from your baseline period because, say, you know the data size would change or the volume of transactions would increase. Once you identified the query you would like to further investigate, the next step is to look further into query store data and see how the baseline statistics compare to the current period and collect additional clues.

create or replace function compare_baseline_to_current_by_query_id(baseline_interval_cutoff int,baseline_interval_type text,query_id bigint,percentile decimal default 1.00)
returns table(
     query_id bigint,
     period text,
     percentile numeric,
     total_time numeric,
     min_time numeric,
     max_time numeric,
     rows numeric,
     shared_blks_hit numeric,
     shared_blks_read numeric,
     shared_blks_dirtied numeric,
     shared_blks_written numeric,
     local_blks_hit numeric,
     local_blks_read numeric,
     local_blks_dirtied numeric,
     local_blks_written numeric,
     temp_blks_read numeric,
     temp_blks_written numeric,
     blk_read_time numeric,
     blk_write_time numeric
)
as $$

with data_set as
( select *
, ( case when start_time >= current_timestamp - ($1 || $2)::interval then 'current' else 'baseline' end ) as period
from query_store.qs_view where query_id = ( $3 )
)
select query_id
, period
, round((case when $4 <= 1 then 100 * $4 else $4 end)::numeric,2) as percentile
, round(percentile_cont($4) within group ( order by total_time asc)::numeric,2) as total_time
, round(percentile_cont($4) within group ( order by min_time asc)::numeric,2) as min_time
, round(percentile_cont($4) within group ( order by max_time asc)::numeric,2) as max_time
, round(percentile_cont($4) within group ( order by rows asc)::numeric,2) as rows
, round(percentile_cont($4) within group ( order by shared_blks_hit asc)::numeric,2) as shared_blks_hit
, round(percentile_cont($4) within group ( order by shared_blks_read asc)::numeric,2) as shared_blks_read
, round(percentile_cont($4) within group ( order by shared_blks_dirtied asc)::numeric,2) as shared_blks_dirtied
, round(percentile_cont($4) within group ( order by shared_blks_written asc)::numeric,2) as shared_blks_written
, round(percentile_cont($4) within group ( order by local_blks_hit asc)::numeric,2) as local_blks_hit
, round(percentile_cont($4) within group ( order by local_blks_read asc)::numeric,2) as local_blks_read
, round(percentile_cont($4) within group ( order by local_blks_dirtied asc)::numeric,2) as local_blks_dirtied
, round(percentile_cont($4) within group ( order by local_blks_written asc)::numeric,2) as local_blks_written
, round(percentile_cont($4) within group ( order by temp_blks_read asc)::numeric,2) as temp_blks_read
, round(percentile_cont($4) within group ( order by temp_blks_written asc)::numeric,2) as temp_blks_written
, round(percentile_cont($4) within group ( order by blk_read_time asc)::numeric,2) as blk_read_time
, round(percentile_cont($4) within group ( order by blk_write_time asc)::numeric,2) as blk_write_time
from data_set
group by 1, 2
order by 1, 2 asc;
$$
language 'sql';

Once you create the function, provide the query id you would like to investigate. The function will compare the aggregate values between the before and after based on the cutoff time you provide. For instance, the below statement would compare all points prior to two hours from now to points after the two hours mark up until now for the query. If you are aware of outliers that you want to exclude, you can use a percentile value.

select * from compare_baseline_to_current_by_query_id(30, 'minutes', 4271834468, 0.95);

If you don’t use any, the default value is 100 which does include all data points.

select * from compare_baseline_to_current_by_query_id(2, 'hours', 4271834468);

Azure Certification, Azure Guides, Azure Tutorial and Material, Azure Learning

If you rule out that there is not a significant data size change and the cache hit ratio is rather steady, you may also want to investigate any obvious wait event occurrence changes within the same period. As wait event types combine different wait types into buckets similar by nature, there is not a single prescription on how to analyze the data. However, a general comparison may give us ideas around the system state change.

create or replace function compare_baseline_to_current_by_wait_event (baseline_interval_start int,baseline_interval_type text,current_interval_start int,current_interval_type text)
returns table(
     wait_event text,
     baseline_count bigint,
     current_count bigint,
     current_to_baseline_factor double precision,
     percent_change numeric
)
as $$
with data_set as
( select event_type || ':' || event as wait_event
, sum( case when start_time >= current_timestamp - ($1 || $2)::interval and start_time < current_timestamp - ($3 || $4)::interval then 1 else 0 end ) as baseline_count
, sum( case when start_time >= current_timestamp - ($3 || $4)::interval then 1 else 0 end ) as current_count
, extract(epoch from ( $1 || $2 ) ::interval) / extract(epoch from ( $3 || $4 ) ::interval) as current_to_baseline_factor
from query_store.pgms_wait_sampling_view where query_id != 0
group by event_type || ':' || event
) ,
wait_event_data as
( select *
, round(( case when baseline_count = 0 then 0 else (100*((current_to_baseline_factor*current_count) - baseline_count) / baseline_count) end )::numeric,2) as percent_change
from data_set
)
select * from wait_event_data order by percent_change desc;
$$
language 'sql';

select * from compare_baseline_to_current_by_wait_event (7, 'days', 2, 'hours');

The above query will let you see some abnormal changes between the two periods. Note that event count here is taken as an approximation and the numbers should be taken within the context of the comparative load of the instance given the time.

Azure Certification, Azure Guides, Azure Tutorial and Material, Azure Learning

As you can see, with the available time series data in Query Store, your creativity is your limit to the kinds of analysis and algorithms you could implement here. We showed you some simple calculations by which you could apply straight forward techniques to identify candidates and improve. We hope that this could be your starting point and that you share with us what works, what doesn’t and how you take this to the next level.

Thursday, 10 January 2019

Streamlined development experience with Azure Blockchain Workbench 1.6.0

We’re happy to announce the release of Azure Blockchain Workbench 1.6.0. It includes new features such as application versioning, updated messaging, and streamlined smart contract development. You can deploy a new instance of Workbench through the Azure portal or upgrade existing deployments to 1.6.0 using our upgrade script.

Please note the breaking changes section, as the removal of the WorkbenchBase base class and the changes to the outbound messaging format will require modifications to your existing applications.

This update includes the following improvements:

Application versioning


One of the most popular feature requests from you all has been that you would like to have an easy way to manage and version your Workbench applications instead of having to manually change and update your applications as you are in the development process.

We’ve continued to improve the Workbench development story with support for application versioning with 1.6.0 via the web app as well as the REST API. You can upload new versions directly from the web application by clicking “Add version.” Note that if you have any changes in the application role name, the role assignment will not be carried over to the new version.

Azure Blockchain Workbench, Azure Guides, Azure Certification, Azure Tutorial and Materials

Azure Blockchain Workbench, Azure Guides, Azure Certification, Azure Tutorial and Materials

Azure Blockchain Workbench, Azure Guides, Azure Certification, Azure Tutorial and Materials

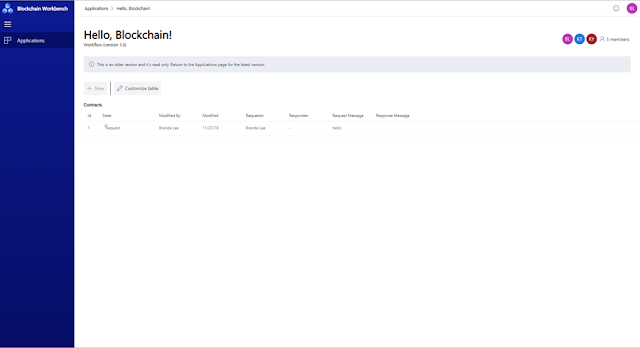
You can also view the application version history. To view and access older versions, select the application and click “version history” in the command bar. Note, that as of now by default older versions are read only. If you would like to interact with older versions, you can explicitly enable the previous versions.

Azure Blockchain Workbench, Azure Guides, Azure Certification, Azure Tutorial and Materials

Azure Blockchain Workbench, Azure Guides, Azure Certification, Azure Tutorial and Materials

New egress messaging API


Workbench provides many integration and extension points, including via a REST API and a messaging API. The REST API provides developers a way to integrate to blockchain applications. The messaging API is designed for system to system integrations.

In our previous release, we enabled more scenarios with a new input messaging API. In 1.6.0, we have implemented an enhanced and updated output messaging API which publishes blockchain events via Azure Event Grid and Azure Service Bus. This enables downstream consumers to take actions based on these events and messages such as, sending email notifications when there are updates on relevant contracts on the blockchain, or triggering events in existing enterprise resource planning (ERP) systems.

Azure Blockchain Workbench, Azure Guides, Azure Certification, Azure Tutorial and Materials

Here is an example of a contract information message with the new output messaging API. You’ll get the information about the block, a list of modifying transactions for the contract, as well as information about the contract itself such as contract ID and contract properties. You also get information on whether or not the contract was newly created or if a contract update occurred.

{
     "blockId": 123,
     "blockhash": "0x03a39411e25e25b47d0ec6433b73b488554a4a5f6b1a253e0ac8a200d13f70e3",
     "modifyingTransactions": [
         {
             "transactionId": 234,
             "transactionHash": "0x5c1fddea83bf19d719e52a935ec8620437a0a6bdaa00ecb7c3d852cf92e18bdd",
             "from": "0xd85e7262dd96f3b8a48a8aaf3dcdda90f60dadb1",
             "to": "0xf8559473b3c7197d59212b401f5a9f07b4299e29"
         },
         {
             "transactionId": 235,
             "transactionHash": "0xa4d9c95b581f299e41b8cc193dd742ef5a1d3a4ddf97bd11b80d123fec27506e",
             "from": "0xd85e7262dd96f3b8a48a8aaf3dcdda90f60dadb1",
             "to": "0xf8559473b3c7197d59212b401f5a9f07b4299e29"
         }
     ],
     "contractId": 111,
     "contractLedgerIdentifier": "0xf8559473b3c7197d59212b401f5a9f07b4299e29",
     "contractProperties": [
         {
             "workflowPropertyId": 1,
             "name": "State",
             "value": "0"
         },
         {
             "workflowPropertyId": 2,
             "name": "Description",
             "value": "1969 Dodge Charger"
         },
         {
             "workflowPropertyId": 3,
             "name": "AskingPrice",
             "value": "30000"
         },
         {
             "workflowPropertyId": 4,
             "name": "OfferPrice",
             "value": "0"
         },
         {
             "workflowPropertyId": 5,
             "name": "InstanceOwner",
             "value": "0x9a8DDaCa9B7488683A4d62d0817E965E8f248398"
         },
     ],
     "isNewContract": false,
     "connectionId": 1,
     "messageSchemaVersion": "1.0.0",
     "messageName": "ContractMessage",
     "additionalInformation": {}
}

WorkbenchBase class is no longer needed in contract code


For customers who have been using Workbench, you will know that there is a specific class that you need to include in your contract code, called WorkbenchBase. This class enabled Workbench to create and update your specified contract. When developing custom Workbench applications, you would also have to call functions defined in the WorkbenchBase class to notify Workbench that a contract had been created or updated.

With 1.6.0, this code serving the same purpose as WorkbenchBase will now be autogenerated for you when you upload your contract code. You will now have a more simplified experience when developing custom Workbench applications and will no longer have bugs or validation errors related to using WorkbenchBase. See our updated samples, which have WorkbenchBase removed.

This means that you no longer need to include the WorkbenchBase class nor any of the contract update and contract created functions defined in the class. To update your older Workbench applications to support this new version, you will need to change a few items in your contract code files:

◈ Remove the WorkbenchBase class.
◈ Remove calls to functions defined in the WorkbenchBase class (ContractCreated and ContractUpdated).

If you upload an application with WorkbenchBase included, you will get a validation error and will not be able to successfully upload until it is removed. For customers upgrading to 1.6.0 from an earlier version, your existing Workbench applications will be upgraded automatically for you. Once you start uploading new versions, they will need to be in the 1.6.0 format.

Get available updates directly from within Workbench


Whenever a Workbench update is released, we announce the updates via the Azure blog and post release notes in our GitHub. If you’re not actively monitoring these announcements, it can be difficult to figure out whether or not you are on the latest version of Workbench. You might be running into issues while developing which have already been fixed by our team with the latest release.

We have now added the capability to view information for the latest updates directly within the Workbench UI. If there is an update available, you will be able to view the changes available in the newest release and update directly from the UI.

Azure Blockchain Workbench, Azure Guides, Azure Certification, Azure Tutorial and Materials

Breaking changes in 1.6.0


◈ WorkbenchBase related code generation: Before 1.6.0, the WorkbenchBase class was needed because it defined events indicating creation and update of Blockchain Workbench contracts. With this change, you no longer need to include it in your contract code file, as Workbench will automatically generate the code for you. Note that contracts containing WorkbenchBase in the Solidity code will be rejected when uploaded.

◈ Updated outbound messaging API: Workbench has a messaging API for system to system integrations. We have had an outbound messaging API which has been redesigned. The new schema will impact the existing integration work you have done with the current messaging API. If you want to use the new messaging API you will need to update your integration specific code.

- The name of the service bus queues and topics has been changed in this release. Any code that points to the service bus will need to be updated to work with Workbench version 1.6.0.
- ingressQueue - the input queue on which request messages arrive.
- egressTopic - the output queue on which update and information messages are sent.
- The messages delivered in version 1.6.0 are in a different format. Existing code that interrogates the messages from the messaging API and takes action based on its content will need to be updated.
◈ Workbench application sample updates: All Workbench applications sample code are updated since we no longer need the WorkbenchBase class in contract code. If you are on an older version of Workbench and use the samples on GitHub, or vice versa, you will see errors. Upgrade to the latest version of Workbench if you want to use samples.